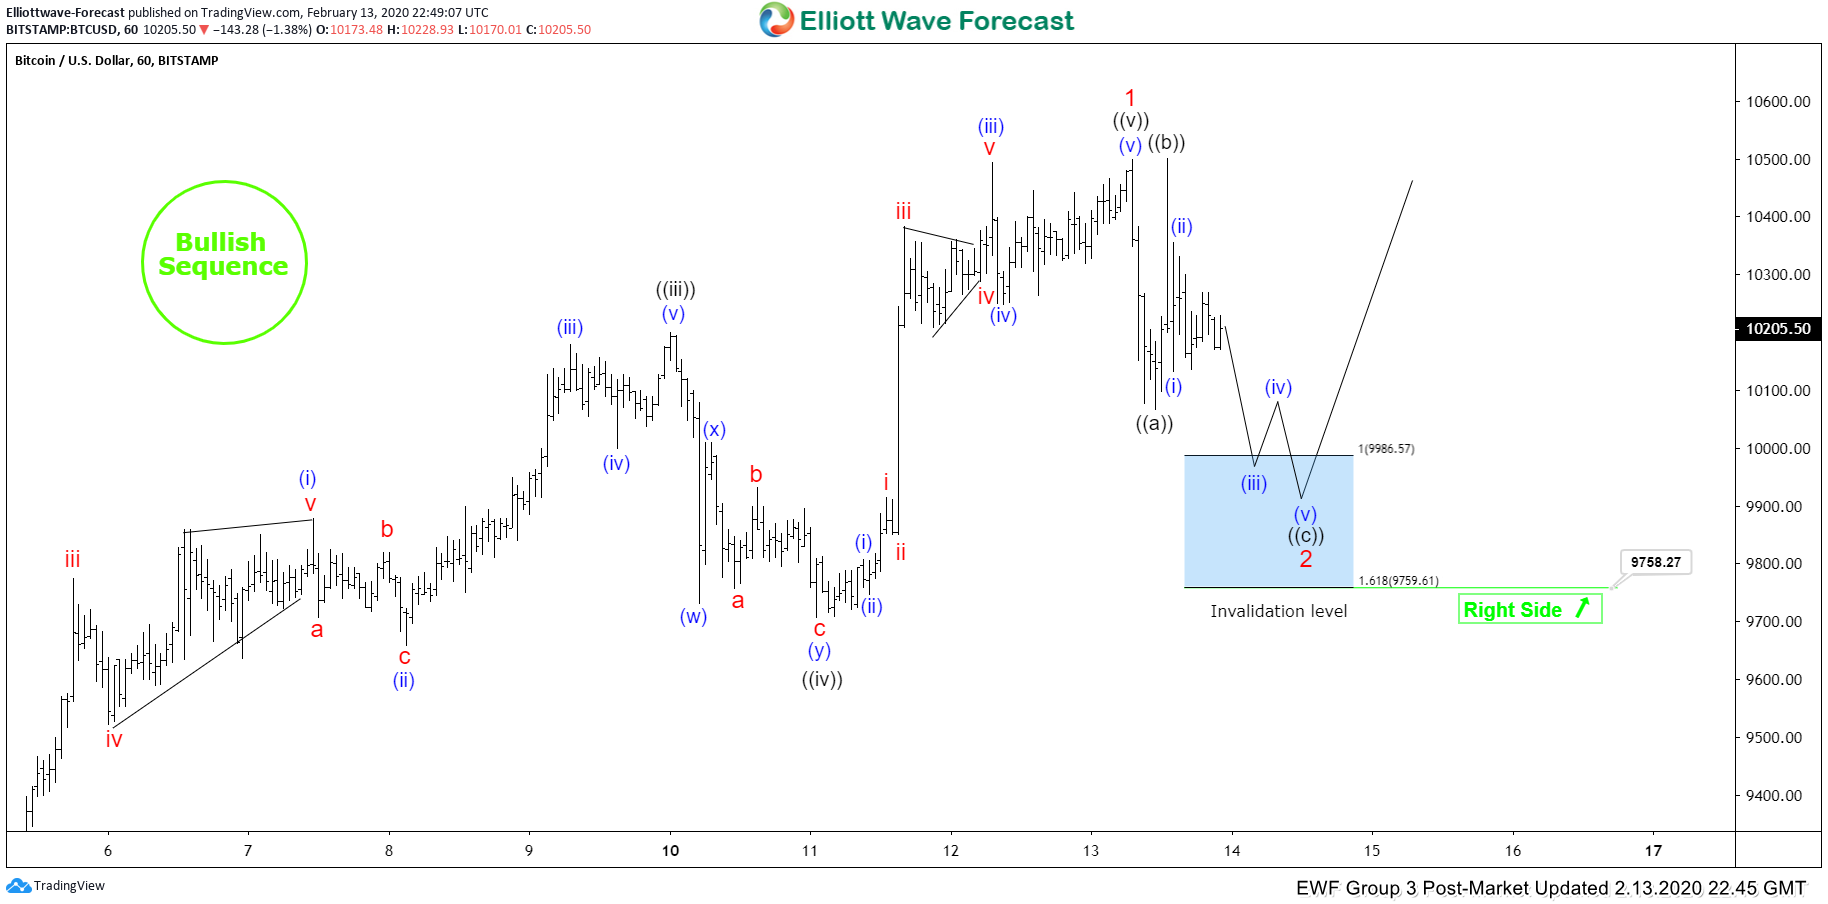
Short term Elliott wave view in Bitcoin (BTCUSD) suggests the rally from January 24, 2020 low has ended as a 5 waves impulse Elliott Wave structure. Up from January 24 low, wave ((i)) ended at 9570 and pullback in wave ((ii)) ended at 9075. The crypto currency then resumed higher in wave ((iii)) towards 10199.85 and the pullback in wave ((iv)) ended at 9706.94. Wave ((v)) of 1 is proposed complete at 10500.
Wave 2 pullback is in progress to correct cycle from January 24, 2020 low before the rally resumes. Internal of wave 2 is unfolding as a zigzag Elliott Wave structure where wave ((a)) ended at 10068 and wave ((b)) bounce ended at 10500. The next potential short term support area for wave ((c)) comes at 9759.61 – 9986.57. This is the 100% – 123.6% Fibonacci extension of wave ((a))-((b)). From this area, Bitcoin can end wave 2 and extends higher or bounce in 3 waves at least. If Bitcoin instead extends above 10500 from here, then it suggests wave ((v)) of 1 remain in progress and can see a few more highs before ending wave 1. We don’t like selling Bitcoin.
Bitcoin 1 Hour Elliott Wave Chart