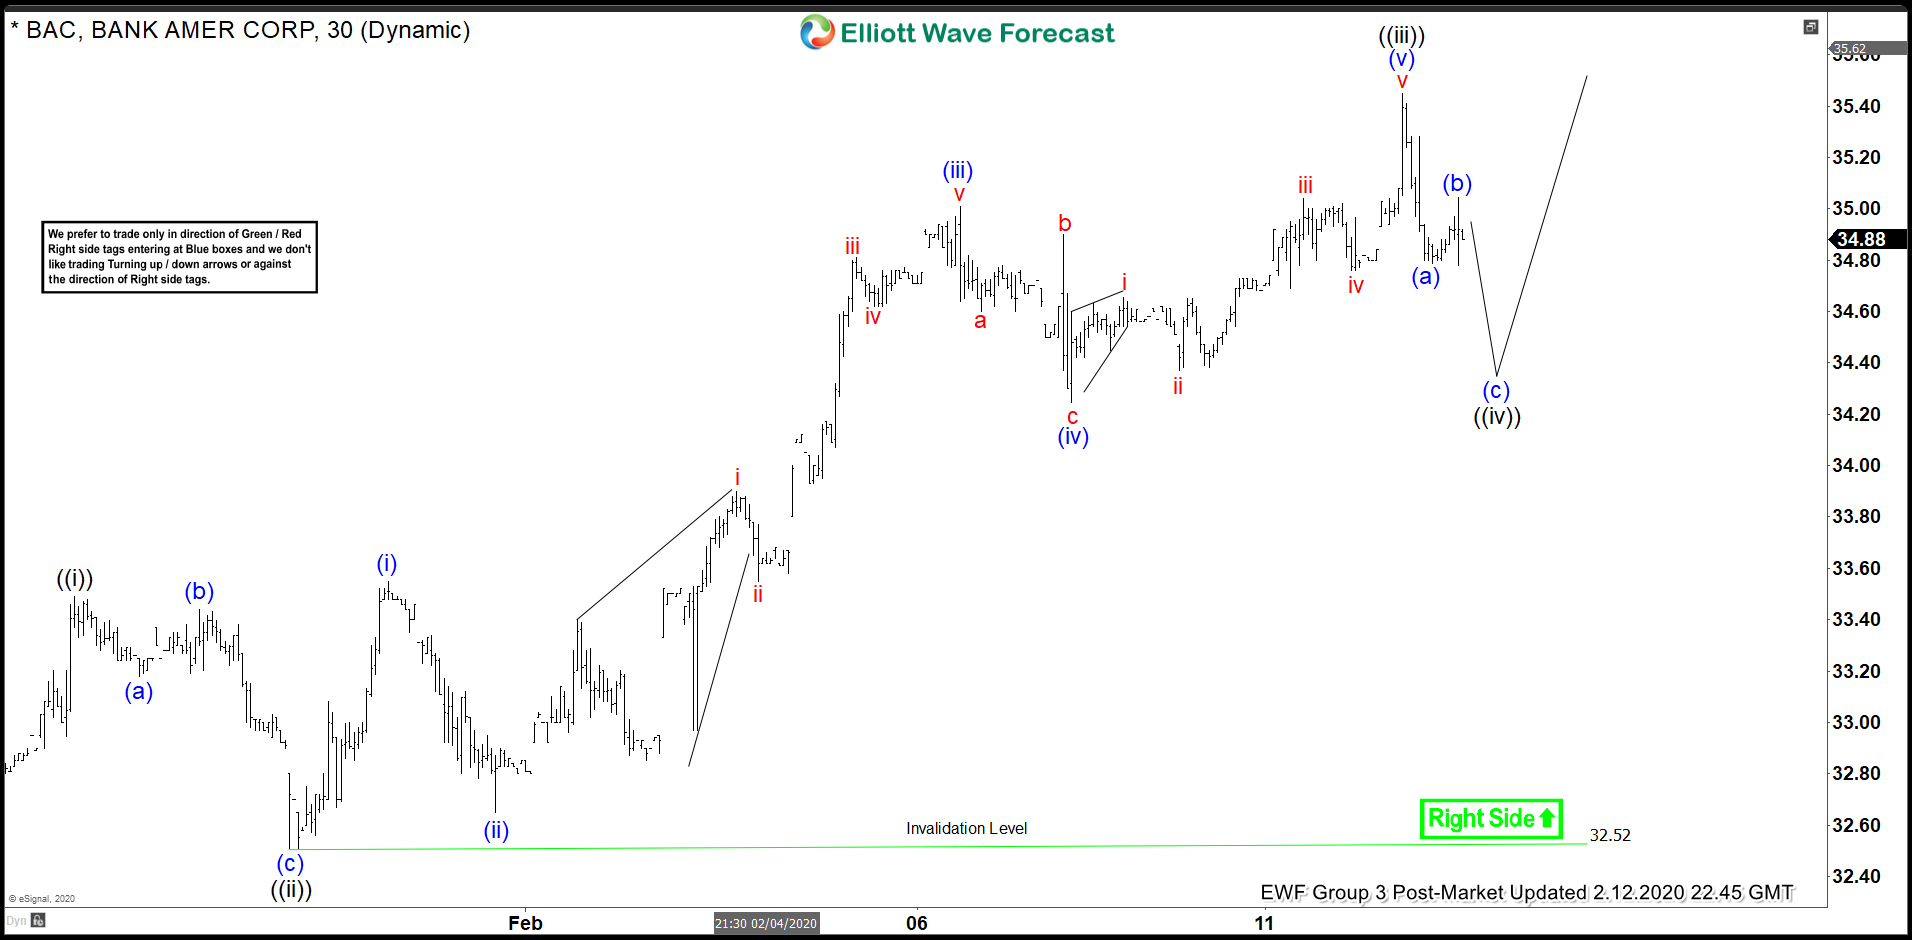
Short term Elliott wave view in Bank of America (ticker: BAC) suggests the rally from January 27, 2020 low is unfolding as a 5 waves impulse Elliott Wave structure. Up from January 27 low, wave ((i)) ended at 33.49 and pullback in wave ((ii)) ended at 32.52. The stock has resumed higher in wave ((iii)) which ended at 35.45. Internal of wave ((iii)) subdivided in 5 waves impulse in lesser degree. Up from 32.52, wave (i) ended at 33.55, and wave (ii) pullback ended at 32.65. Stock then resumed higher in wave (iii) towards at 35.01. Wave (iv) pullback ended at 34.24 and the final leg wave (v) of ((iii)) ended at 35.45.
Wave ((iv)) pullback is in progress to correct cycle from January 30 low before the stock resumes higher in wave ((v)). The pullback is unfolding as a zigzag structure where wave (a) ended at 34.78 and wave (b) ended at 34.97. Potential area to end wave (c) of ((iv)) is 100% – 123.6% Fibonacci extension from February 12 high which comes at 33.9 – 34.3. From this area, BAC can then extend higher or at least bounce in 3 waves.
BAC 1 Hour Elliott Wave Chart