
In this technical blog, we are going to take a look at the past performance of CHFJPY, 1-Hour Elliott wave Charts that we presented to our members. In which, the rally from October 2019 lows showed an impulse structure called for another push higher to complete the 5 wave sequence. Therefore, our members knew that the preferred path remains to buy the dip wave 4 pullback in 3, 7 or 11 swings. We will explain the Elliott wave structure & buying opportunity our members took below:
CHFJPY 1 Hour Elliott Wave Chart
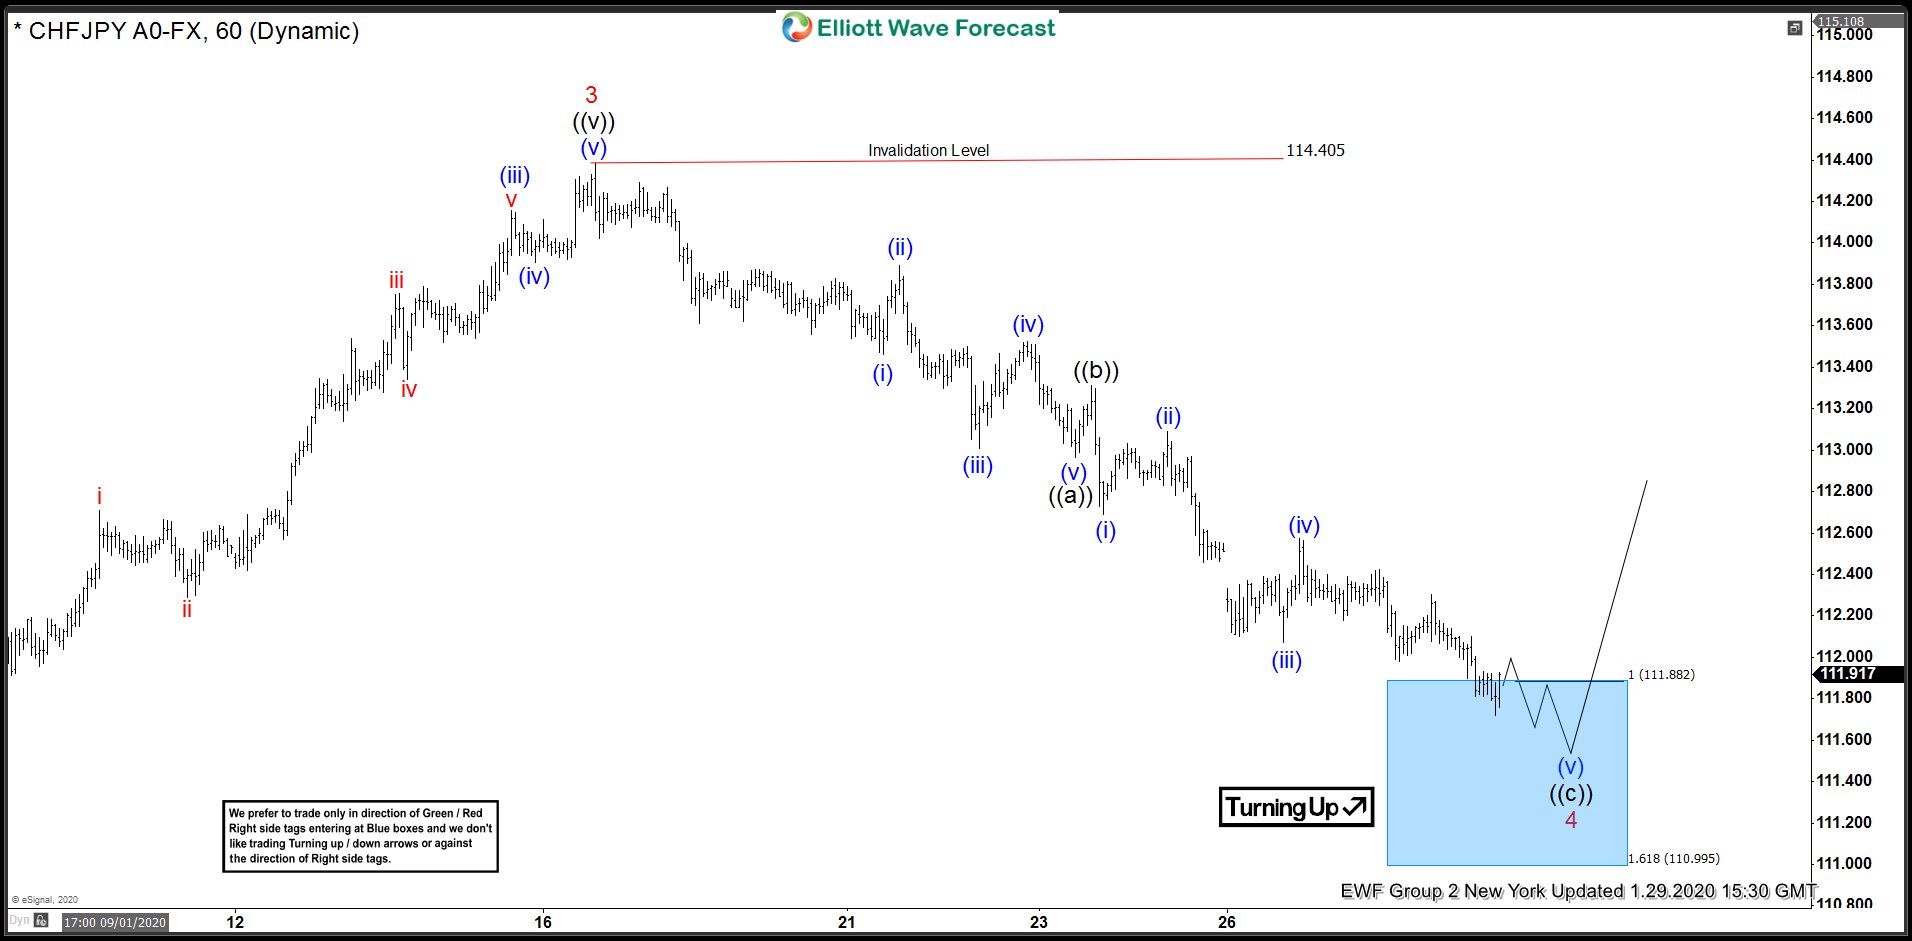
CHFJPY 1 Hour Elliott Wave Chart from 1/29/2020 NY update, in which the pair the rally to 114.40 high ended wave 3 in red. Down from there, the pair corrected lower the cycle from November 2019 lows in wave 4 pullback. The internals of that pullback unfolded as a zigzag structure where wave ((a)) ended at 112.96 low. Wave ((b)) bounce ended at 113.31 high. Wave ((c)) managed to reach the blue box area at 111.88-110.99 100%-161.8% Fibonacci extension area. From where buyers were expected to appear ideally looking for another extension higher in wave 5 in red or to do a 3 wave bounce at least.
CHFJPY 1 Hour Elliott Wave Chart
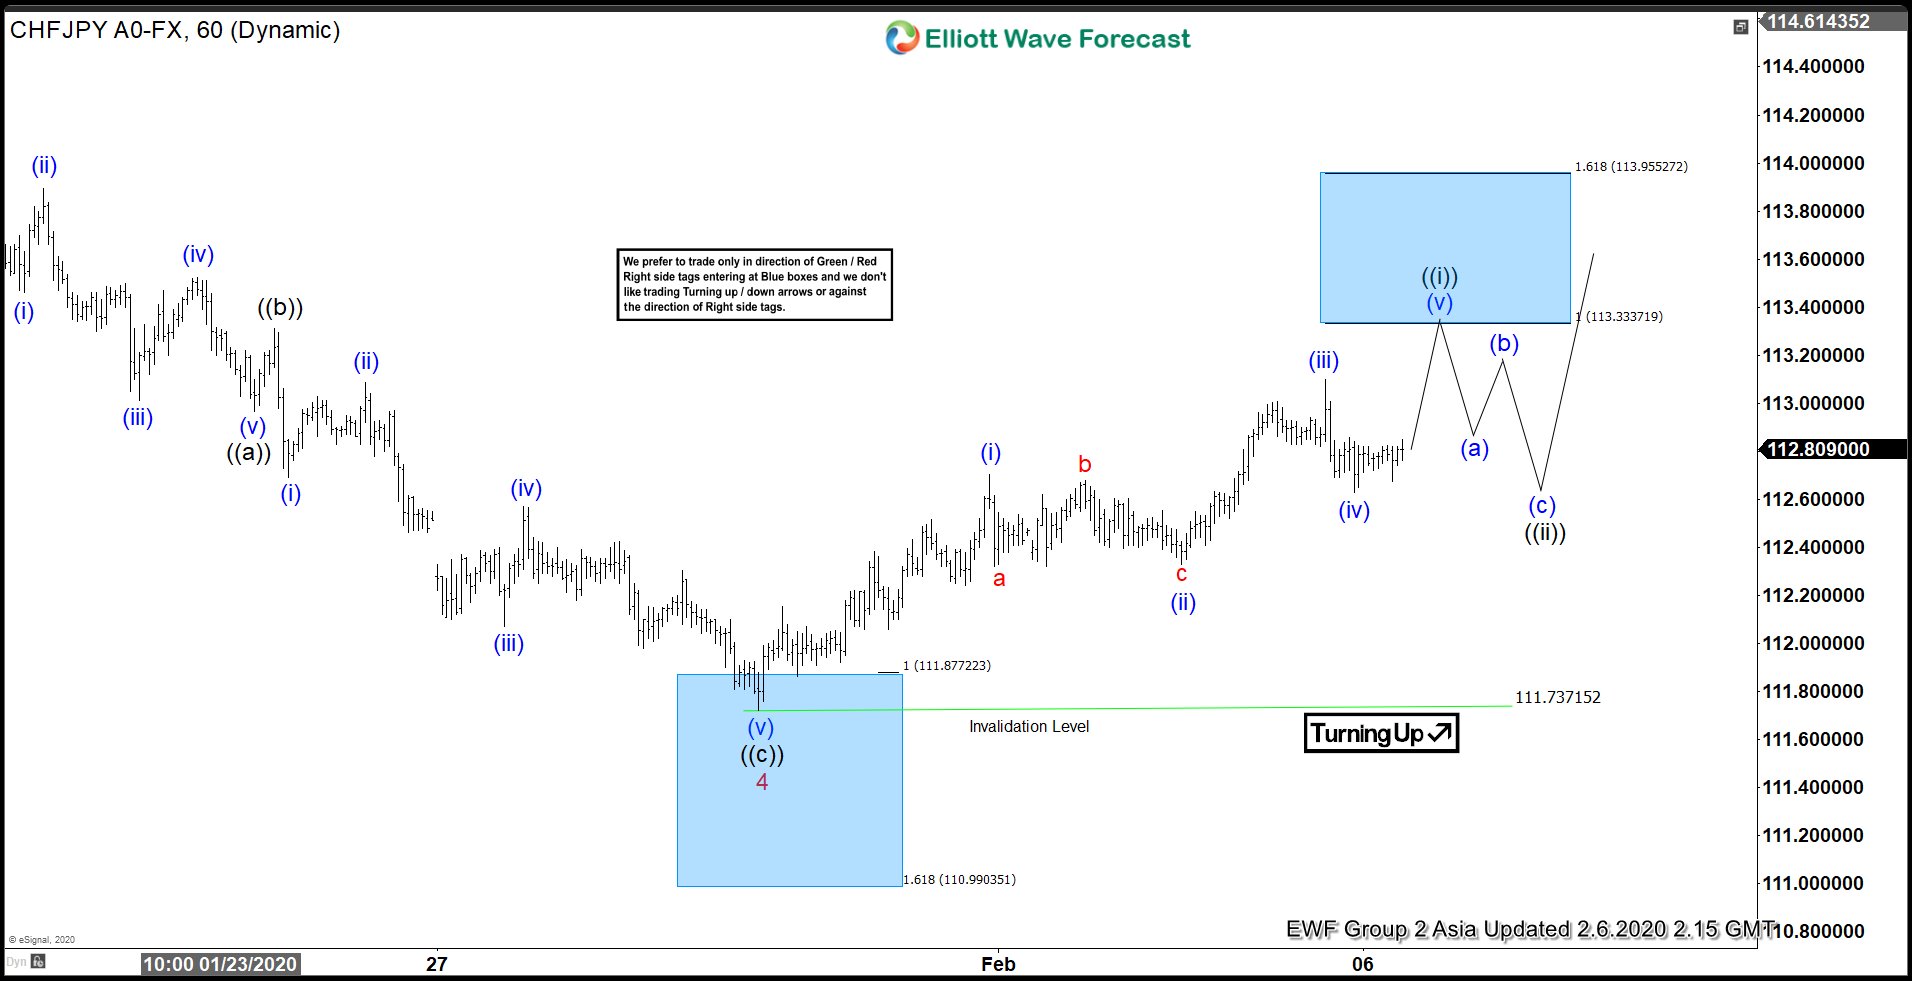
Here’s Latest 1 Hour Elliott Wave Chart from 2/06/2020 Asia update, in which the pair ended wave 4 in red at 111.73 low. And showing reaction higher taking place from the blue box area. Allowed members to create a risk-free position shortly after taking the longs at the blue box area. Now as far as dips remain above 111.73 low pair is expected to resume the upside and reach towards the minimum extension area for wave 5 at 115.01-116.03 target area to the upside. However, a clear break above 1/16/2020 peak (114.40) is still needed to confirm the next extension higher & avoid double correction lower.