TSLA has gained 447% since June 2019 and the vertical rally suggests it is super cycle wave (III) of an Elliott Wave Impulse structure up from all time low. In 2019, we looked for a pull back in TSLA stock followed by more upside and we have been calling it higher since it reached the extreme area down from September 2017 peak. In this blog, we would present some Weekly charts from members area showing how the rally unfolded and in the end we would also talk about some possible targets for this wave (III) and our current view of where we are within this wave (III).
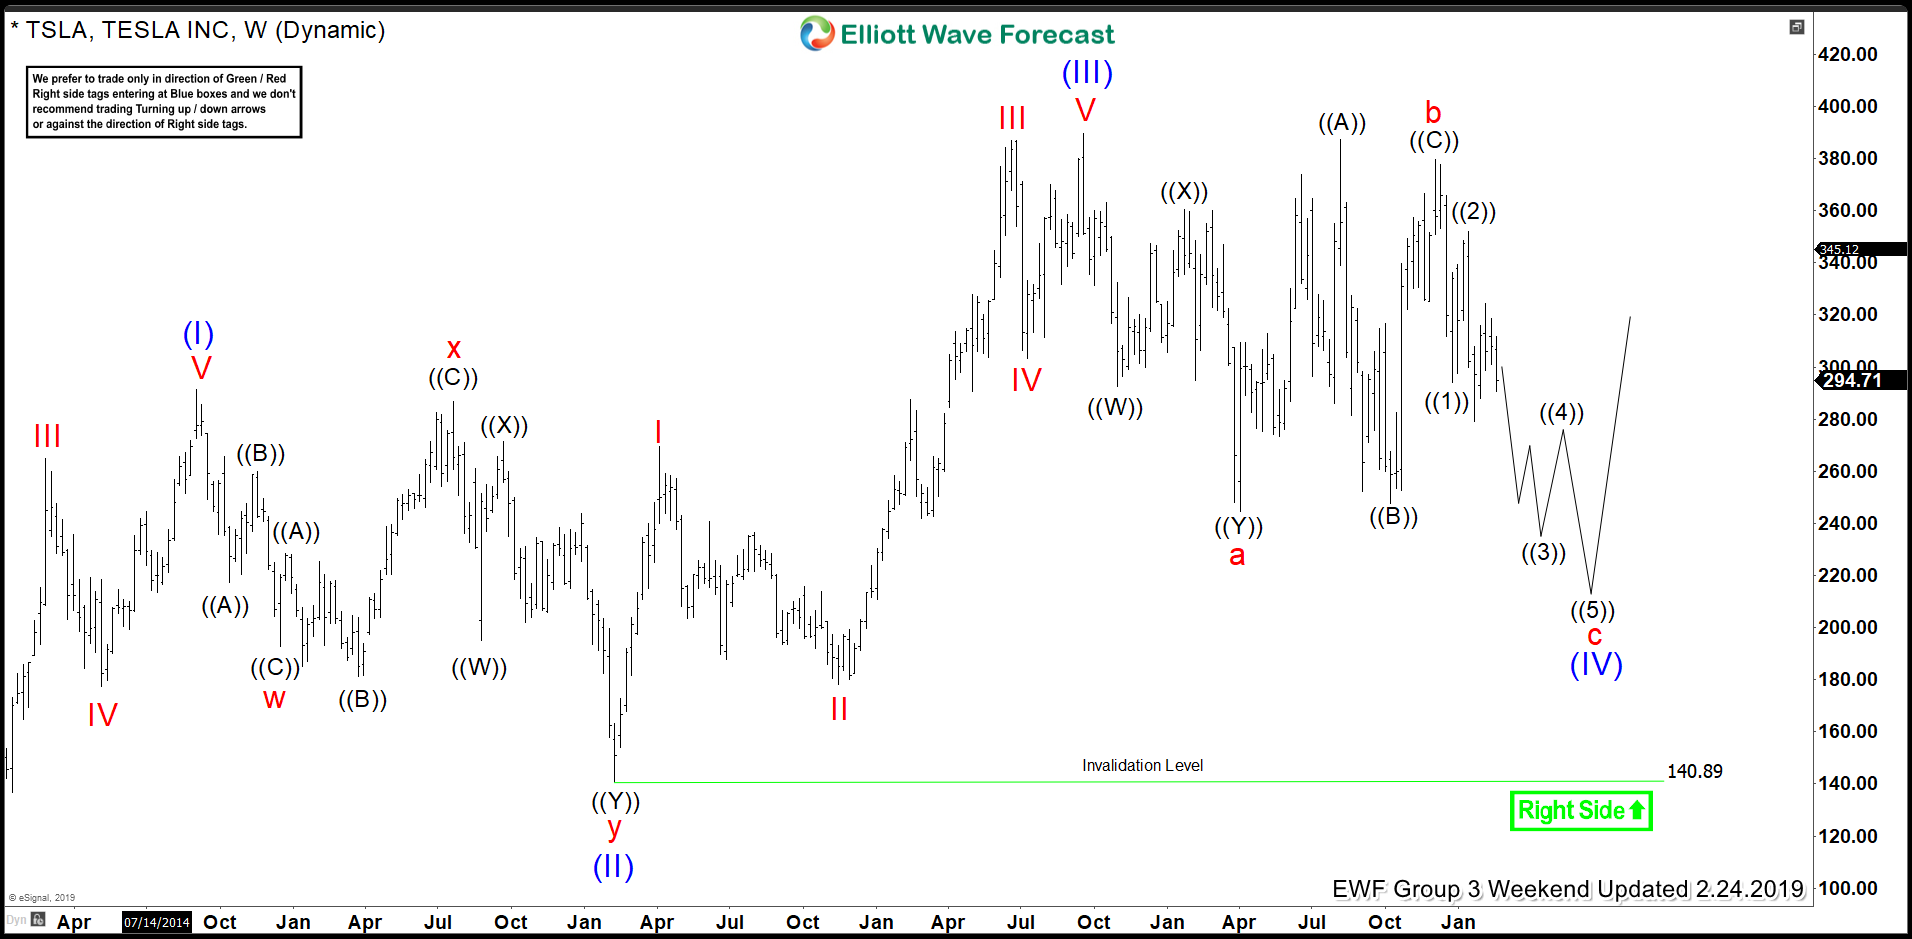
TSLA Weekly Elliott Wave Analysis 24 February 2019
Chart below showed the possibility of TSLA having ended wave (III) at 389.61 and treated the pull back to be a wave ( IV). Since the recovery from April 2018 low was quite deep so we entertained the idea of a 3-3-5 FLAT correction in wave (IV) with more downside to come within wave “c” to complete the correction. Ideal area to complete wave (IV) was 100 – 161.8 Fibonacci extensions of a-b between 233.70 – 143.86.
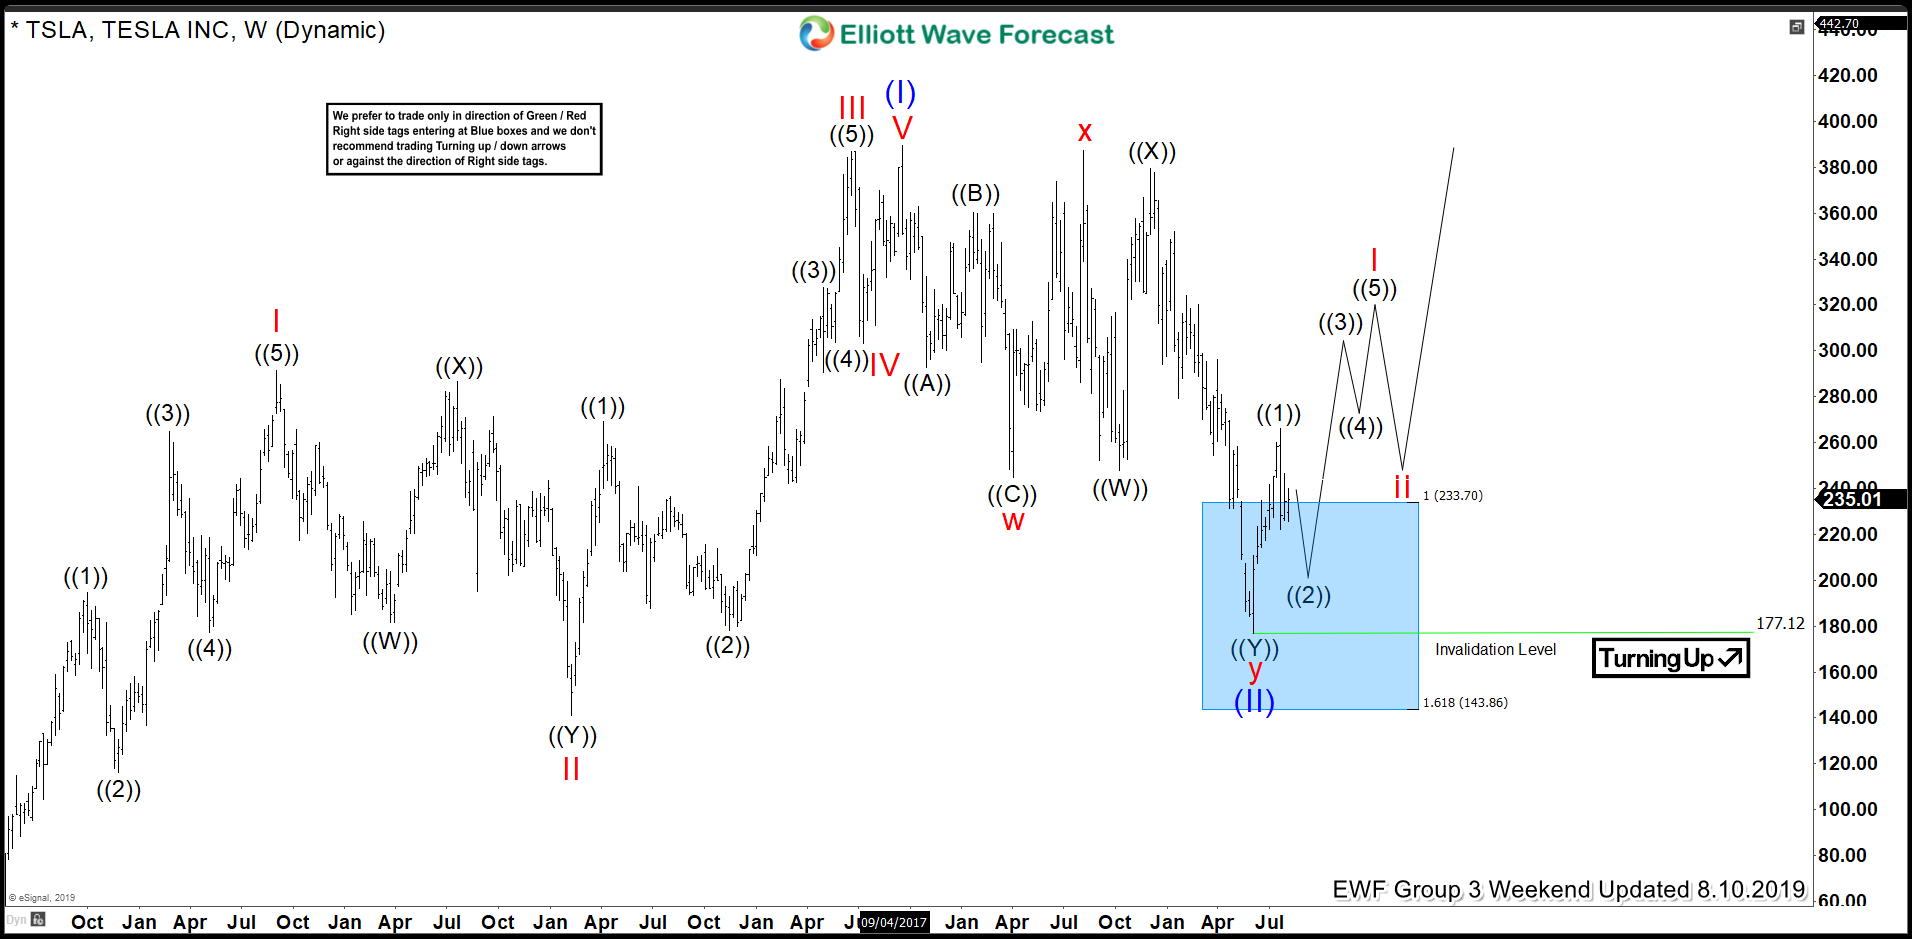
TSLA Elliott Wave Analysis 10 August 2019
Stock reached extreme area down from 389.61 peak but the pivot at wave (II) low in our distribution system gave up suggesting pull back was not wave (IV) but a wave (II) instead so we updated the wave count to reflect that. Updated wave count suggested 389.61 was wave (I) and dip from there into the blue box was wave (II) at 177.12 and we were at the beginning of a power wave (III).
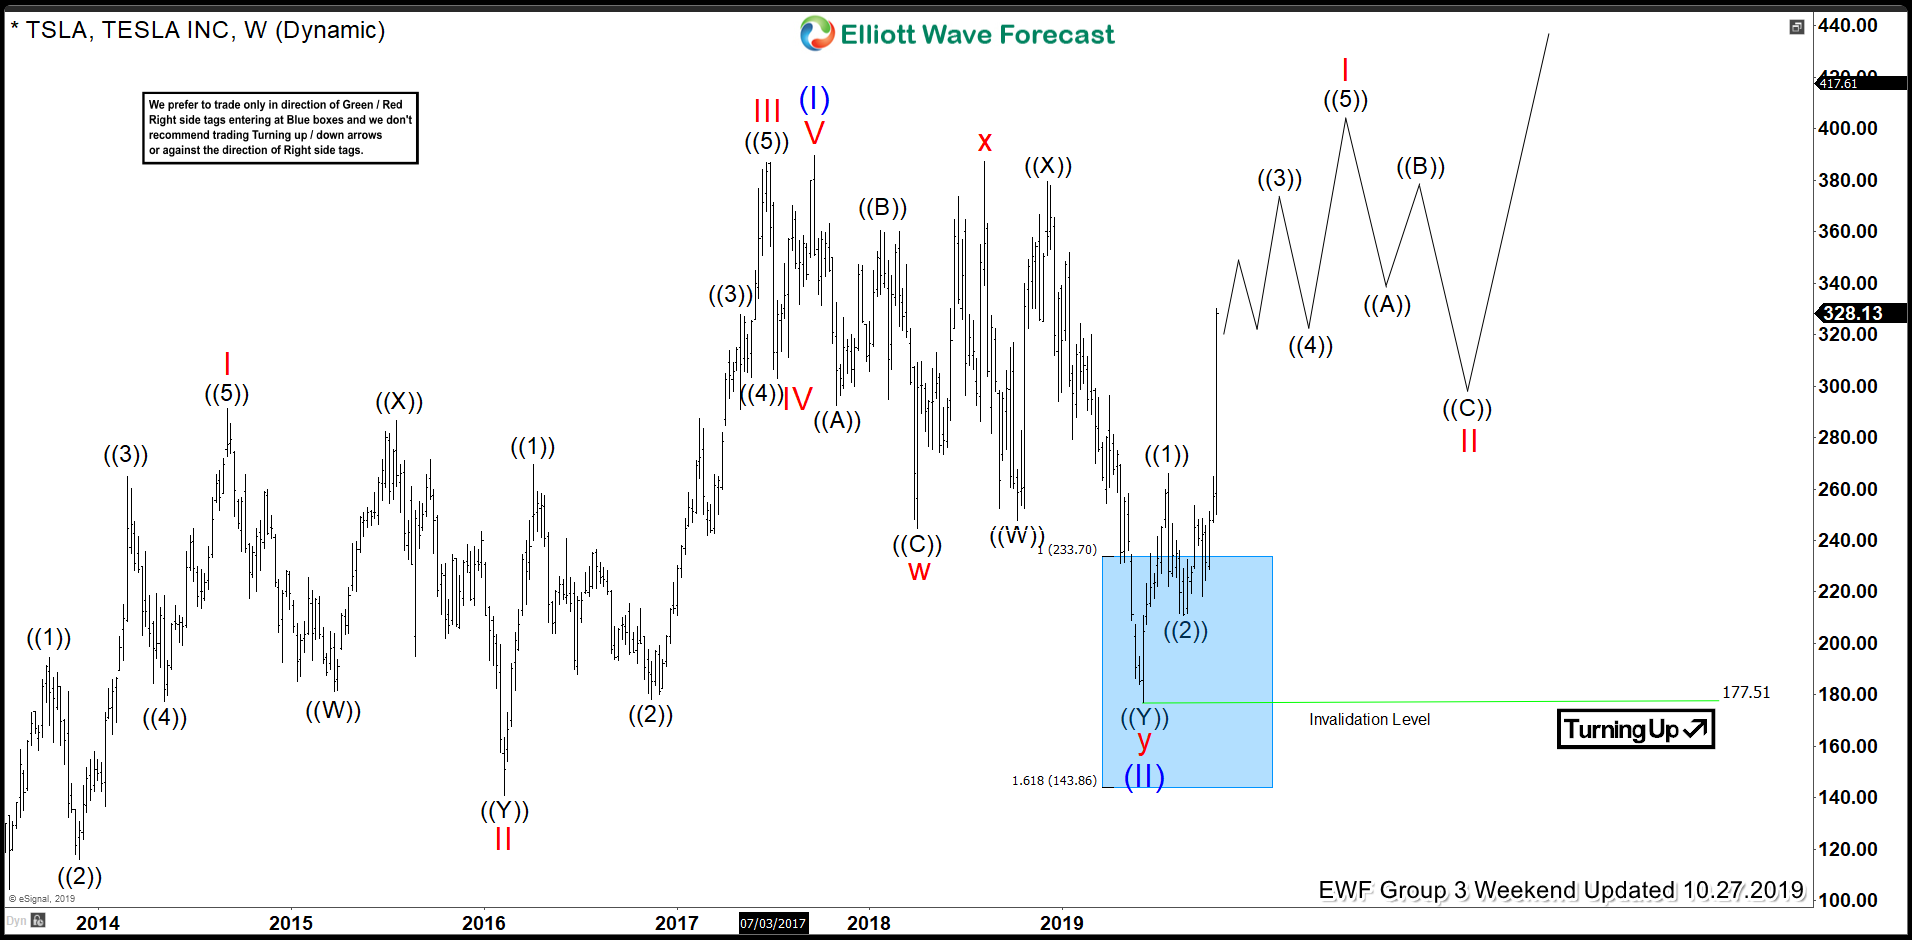
TSLA Weekly Elliott Wave Analysis 27 October 2019
Stock rallied strongly from the highlighted blue box area and the rally looked impulsive in nature so we kept calling higher to finish wave I of (III) before a pull back in wave II and higher again.
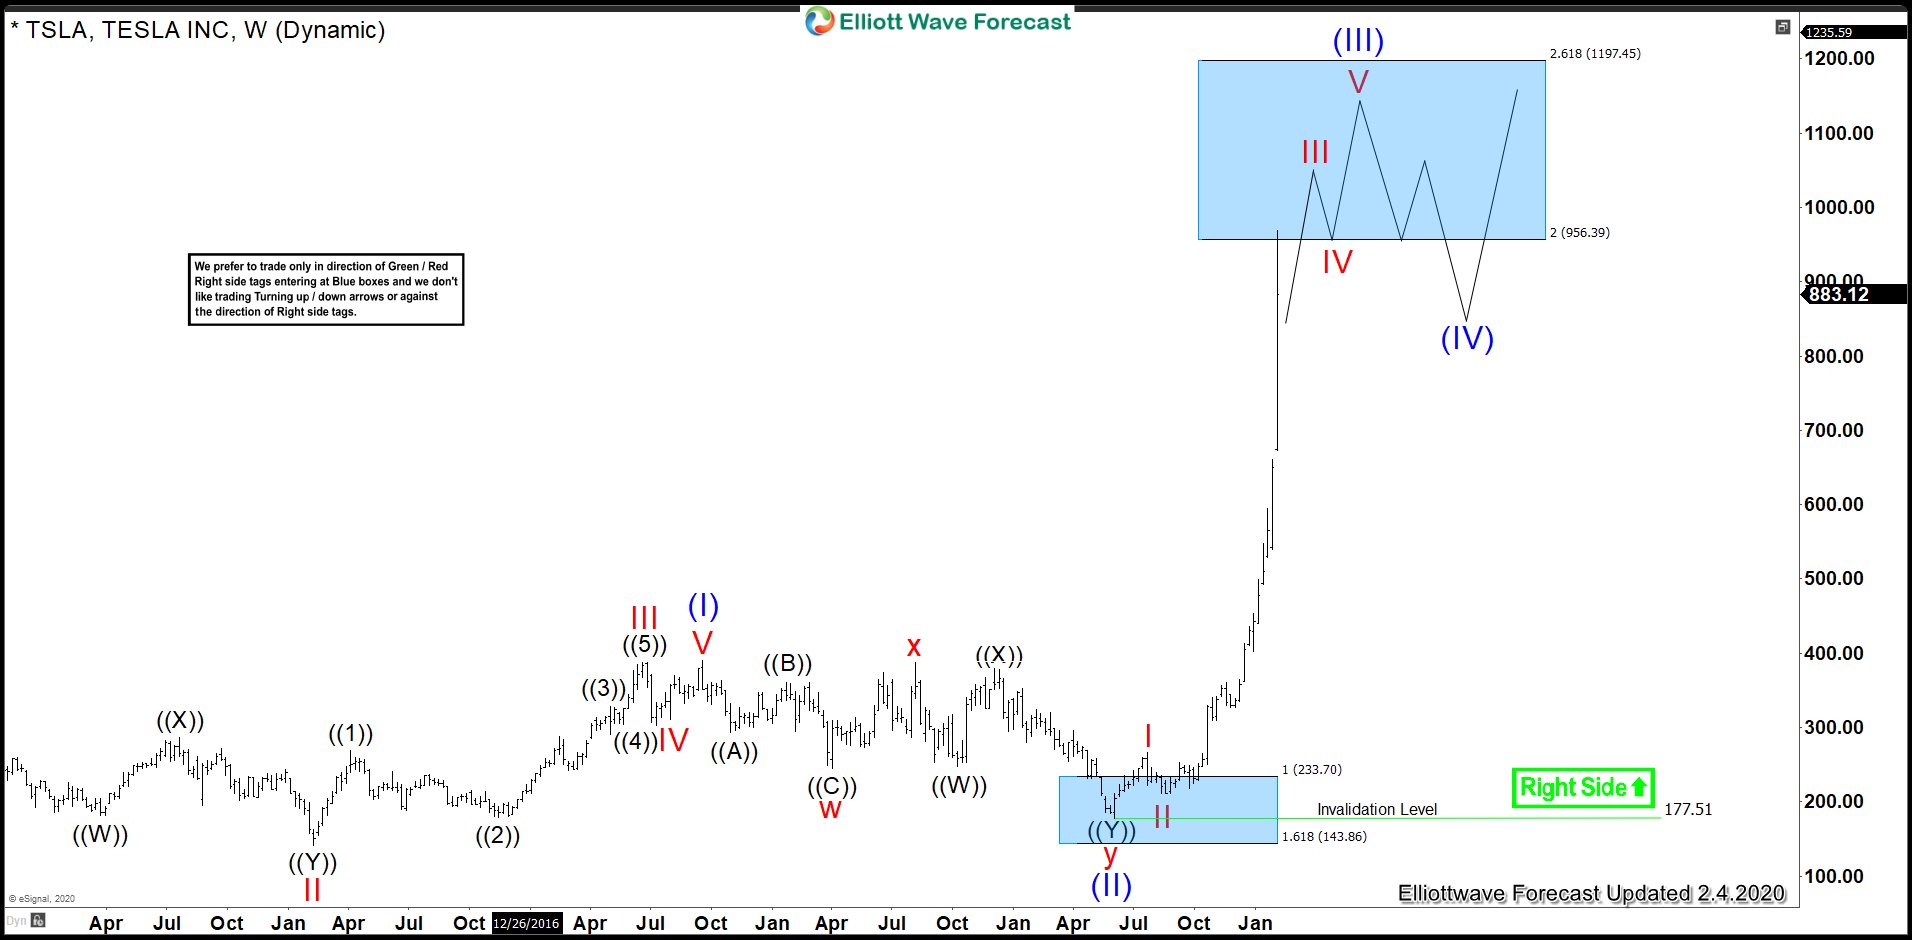
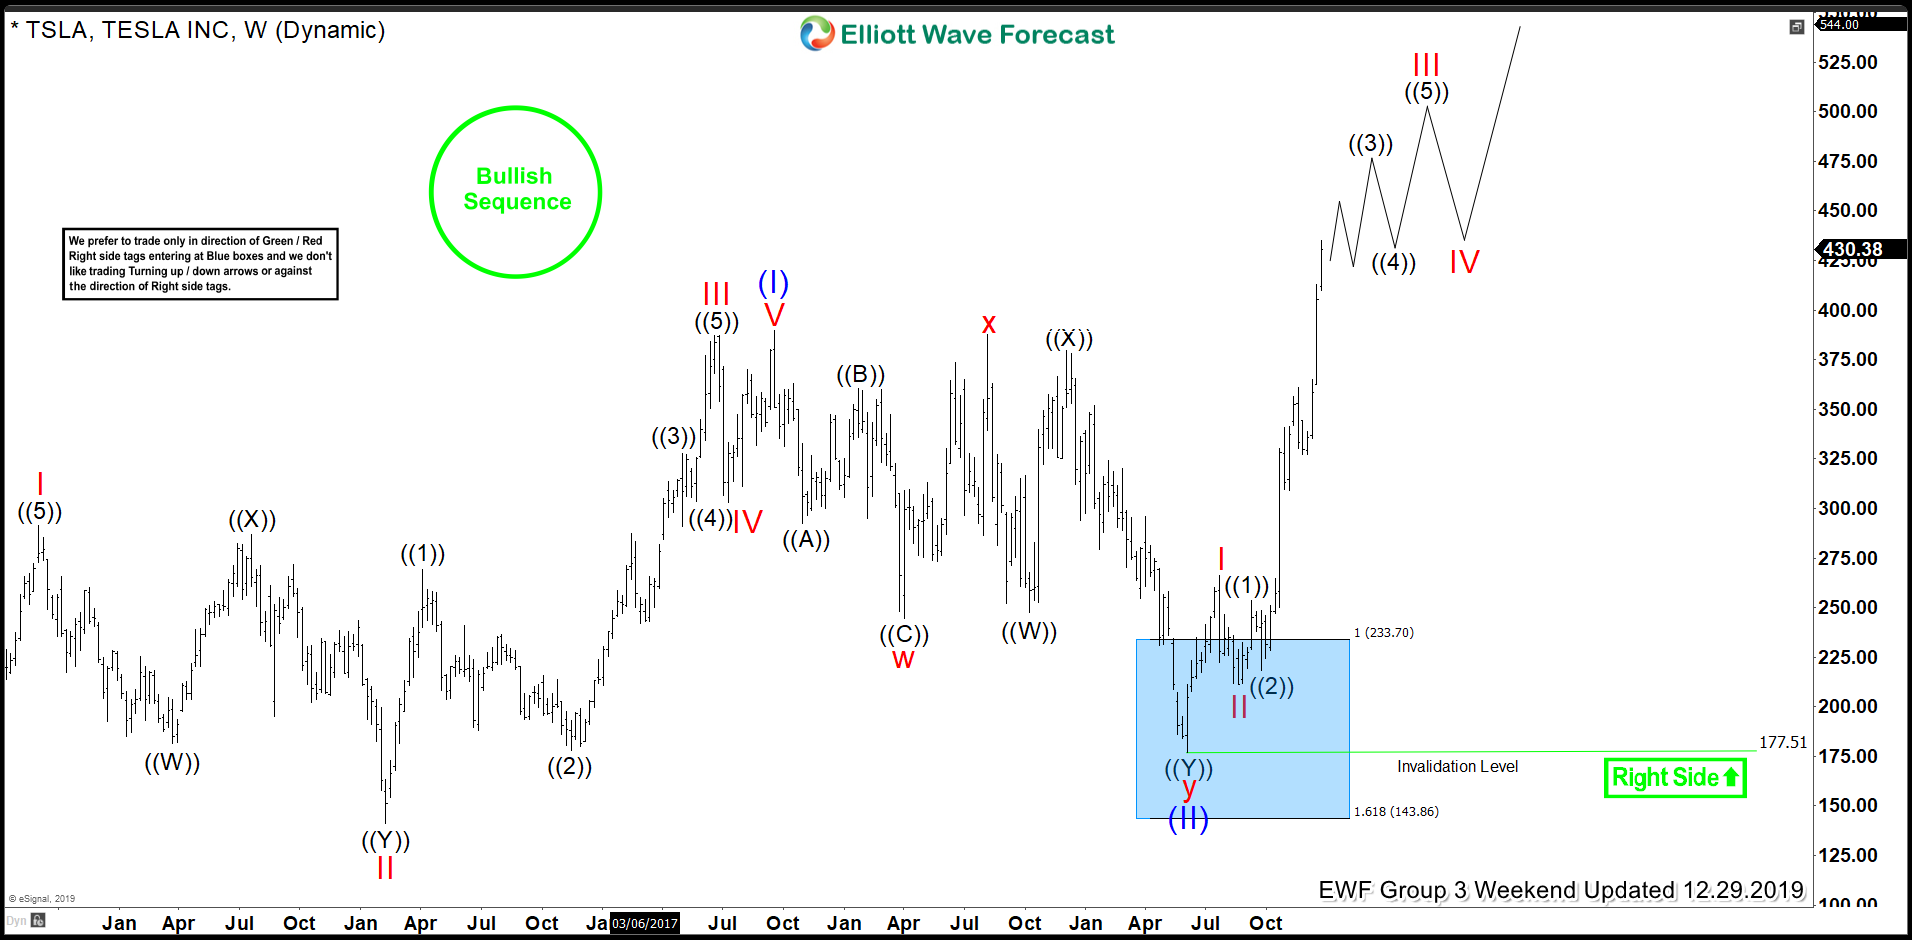
TSLA Weekly Elliott Wave Analysis 29 December 2019
TSLA made a new all time high and as it kept extending higher with shallow pull backs which was an indication that we were already within wave ((3)) of III of super cycle wave (III) with more upside to come.
TSLA Latest Elliott Wave Analysis – Weekly Chart
TSLA has already reached 200% extension of wave (I)-(II) but the rally from wave (II) low is incomplete and it still needs a few more highs to end wave (III) which should be ending in the blue box and could go as high as 1197.45 area and could extend even further before it starts a pull back in wave (IV) to correct the cycle from June 2019 low and then turn higher again in wave (V). It’s already at an extreme area so next good swing opportunity would come after wave (IV) pull back has been seen but we do see more upside still within wave (III) so the buyers should still be in control in the mid-term until wave (III) doesn’t end.