JPMorgan Chase (NYSE: JPM) is the largest bank in the United State. It is a multinational banking and financial service provider that was formed as a result of a merger of several banking companies in 1996.
The Banking sector took its biggest hit during the financial crisis in 2008 as many banks announced bankruptcy and other barley managed to survive .However, based on performance of the top 5 US Banks over the past 12 years, JPM outperformed the Banks industry as it managed to double its stock price above 2007 peak while the rest are struggling to recover against the same peak. Let’s take a look at the monthly chart of JPM.
JPM Long-term Elliott Wave Analysis
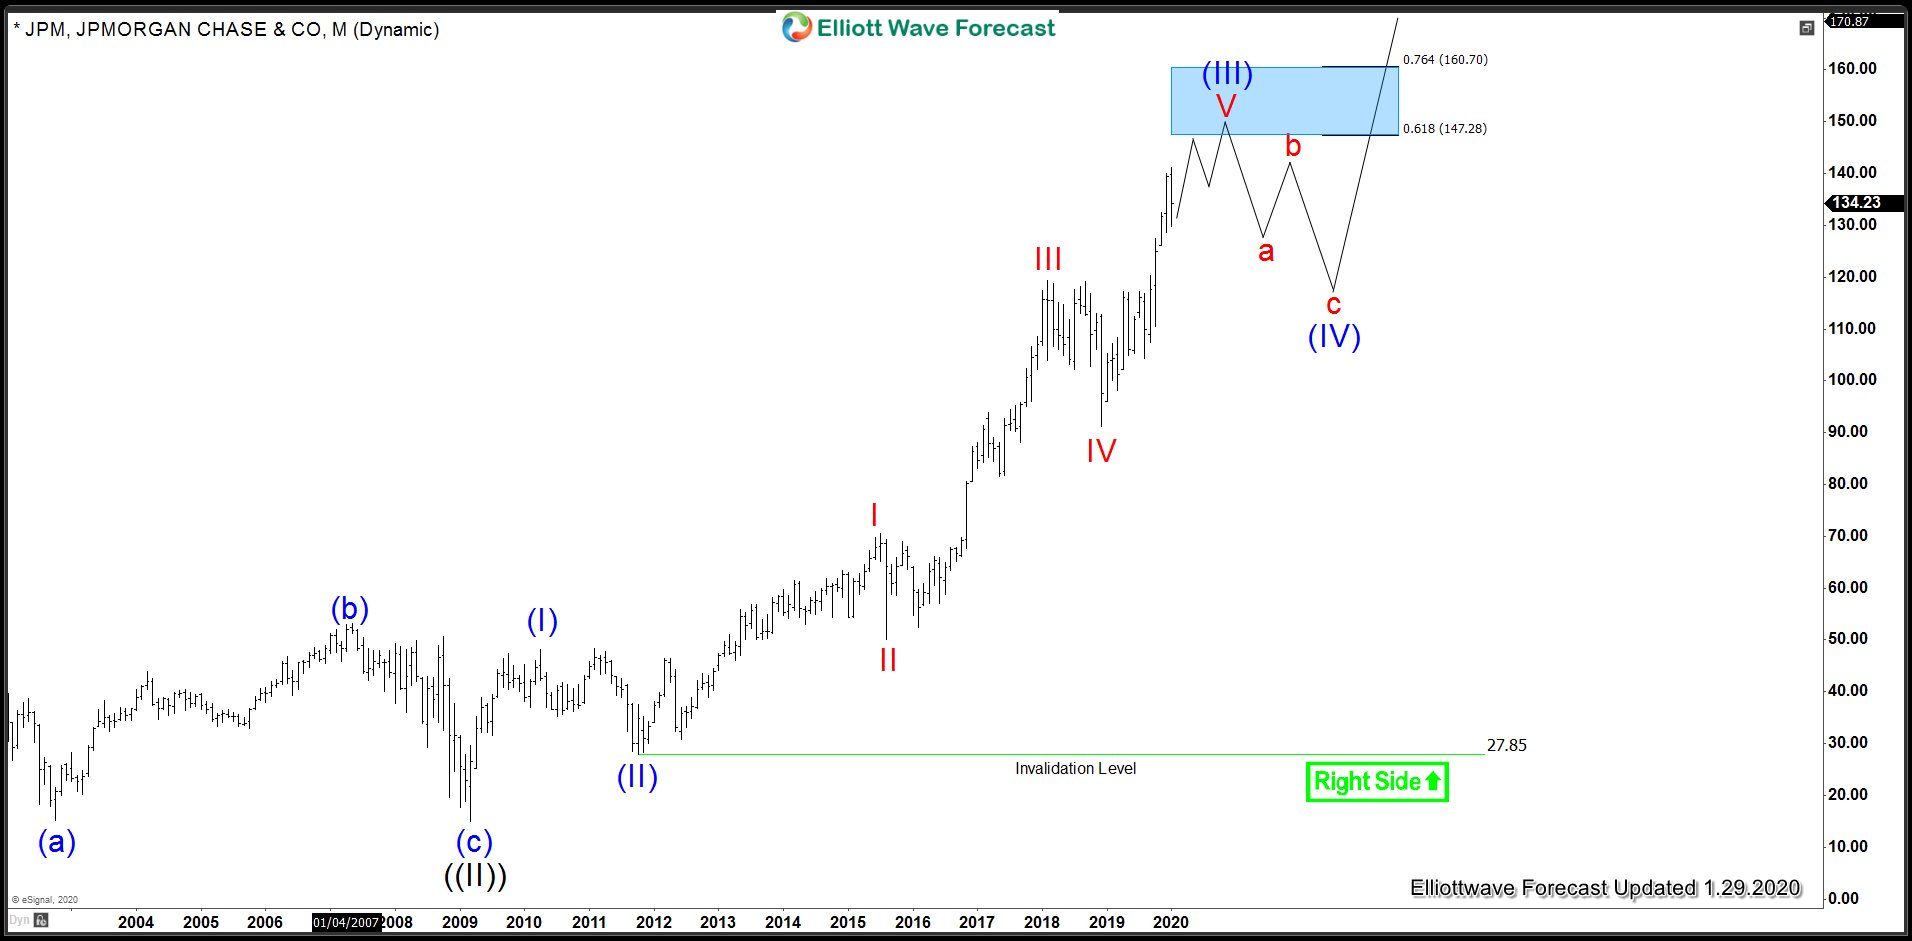
Looking at the Monthly chart for JPM, we understand that 2008 crash was just part of a larger 9 years 3 waves Elliott wave correction which started in 2000 and then ended at 2009 low. Up from there, the stock started rallying higher in an impulsive 5 waves structure making new all time highs along the way.
Based on Elliott Wave Theory, JPM is trading within the wave ((III)) which is considered as the strongest leg in the entire cycle and therefore the stock will be seeking further gains until it ends the cycle from 2009 low. Currently, JPM is advancing in wave V of wave (III) which should be followed by a pullback in wave (IV) to correct the cycle from 2011 low and then the stock should continue higher again to complete wave ((III)) to complete the cycle from 2009 low. Let’s take a look at the daily chart to see structure of the rally within the red wave V and some upside targets.
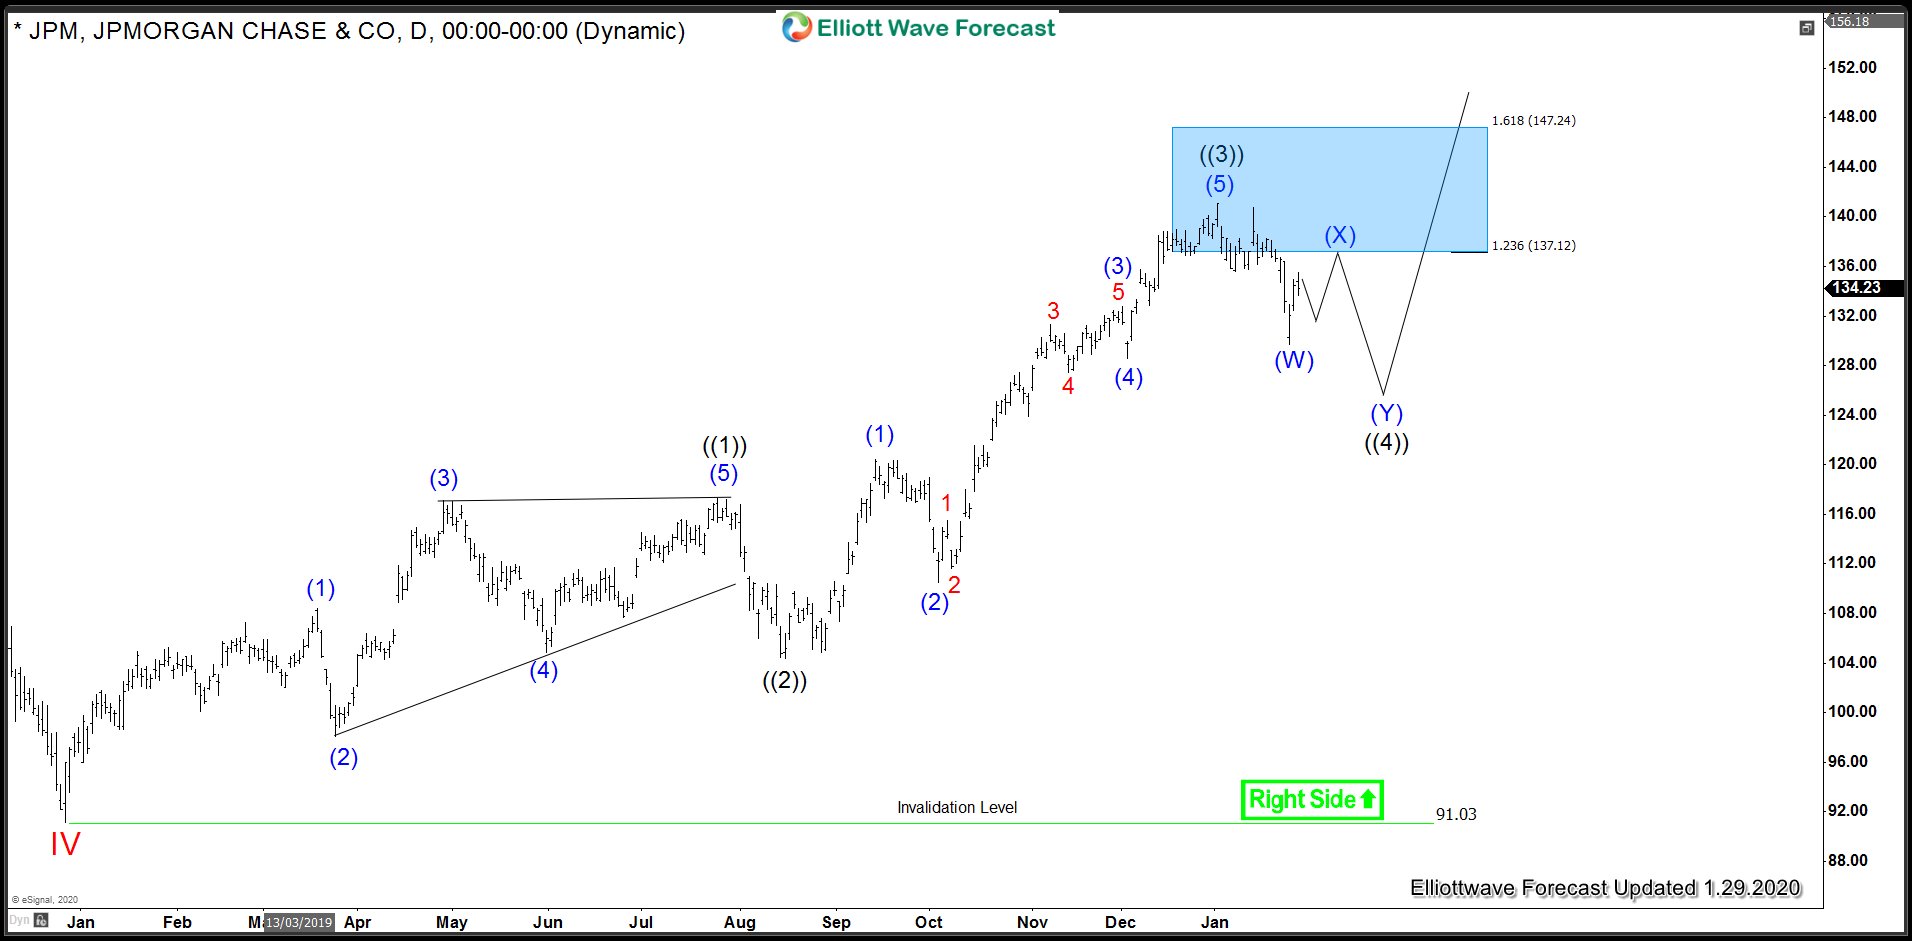
JPM Daily Chart – Cycle from December 2018 low
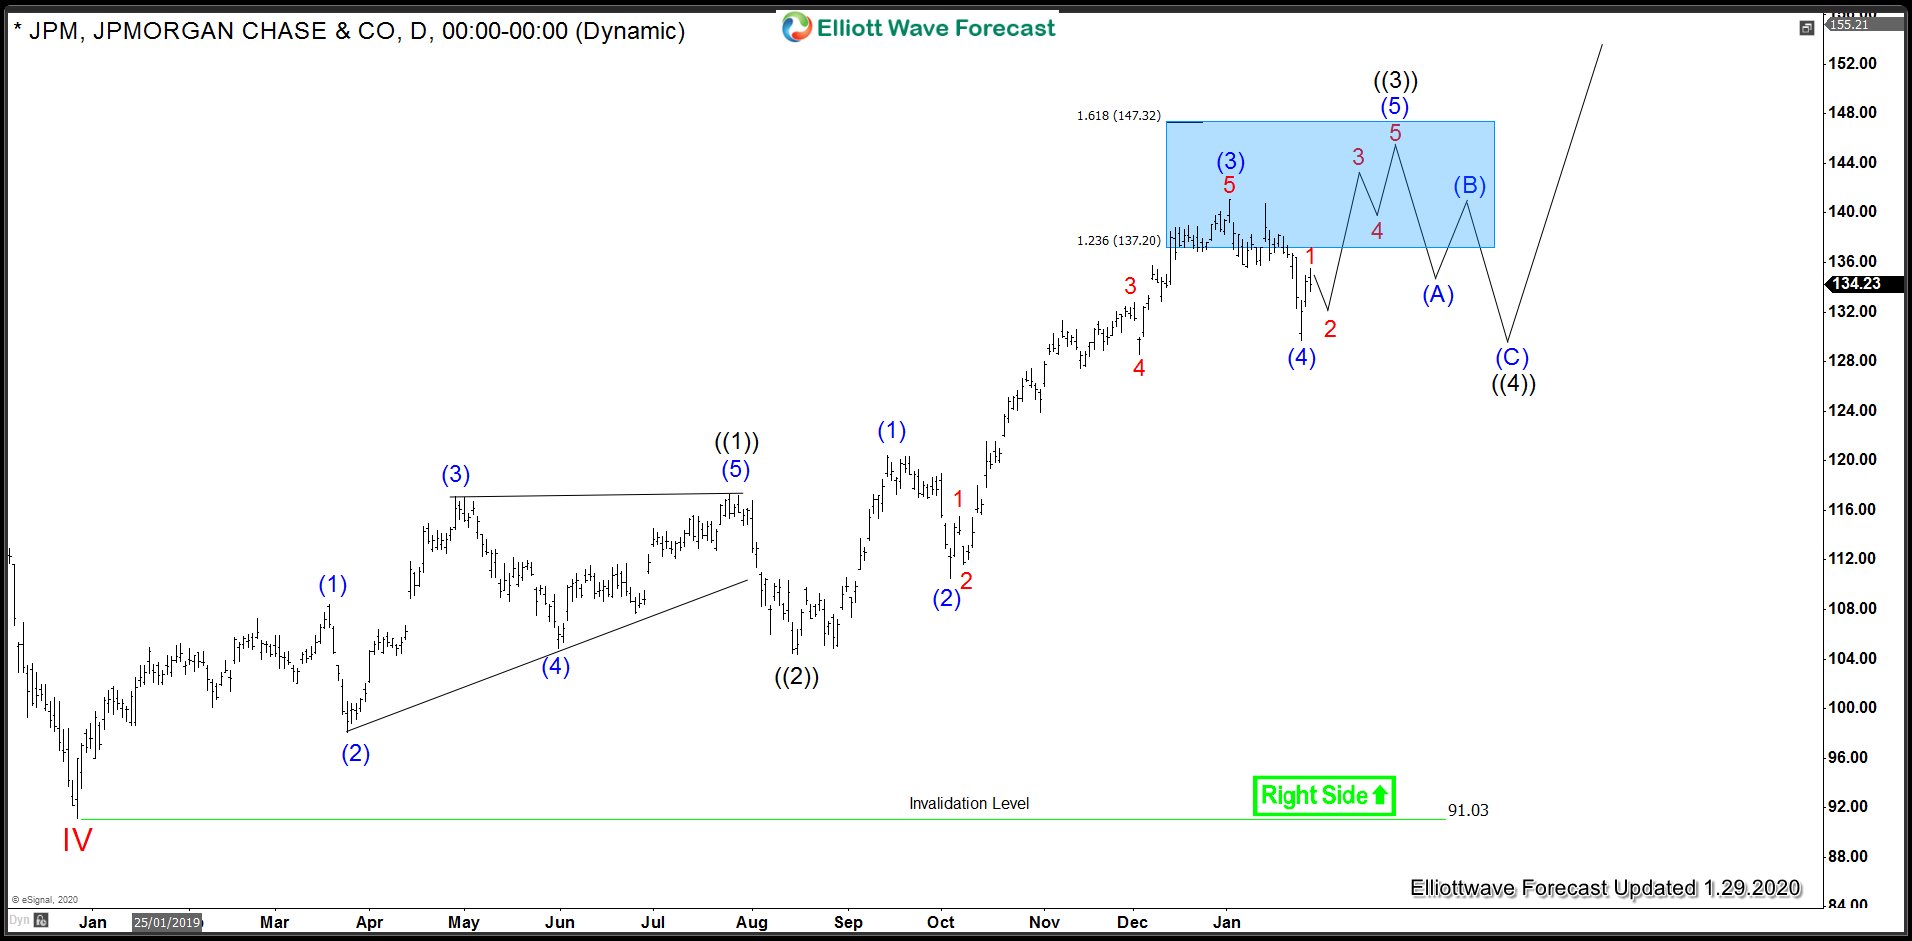
Looking at the structure of rally from December 2018, red IV low, it seems the market is in need of another high to complete wave ((3)) and then it should pull back in wave ((4)) to correct the cycle from wave ((2)) low and turn higher in wave ((5)) to complete red wave V. Alternatively, if it fails to make a new high above 141.10, then it should already be in wave ((4)) and buyers should appear again for the next leg higher.
JPM Daily Chart – Cycle from December 2018 low – Alternate view