
Best Buy is trading within a very Technical Elliott Wave structure with well-defined cycles. Currently, it is showing a five waves advance, but also it has an incomplete sequence. The Five waves structure runs in a sequence of 5-9-13, which comes with a subdivision of three advances in five waves and two pullbacks in three waves. The following chart explains the structure:
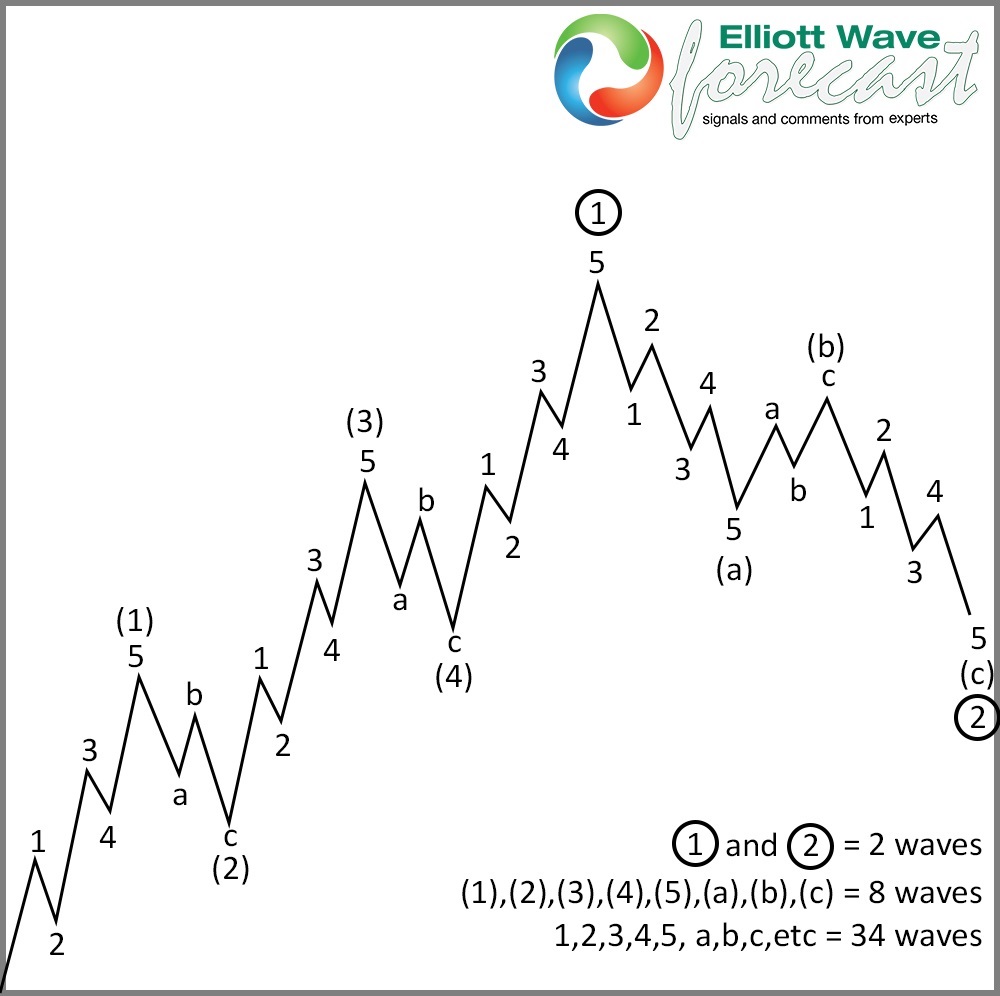
In Elliott’s model, market prices alternate between an impulsive, or motive phase, and a corrective phase on all time scales of the trend. Impulses are always subdivided into a set of 5 lower-degree waves, alternating again between motive and corrective character, so that waves 1, 3, and 5 are impulses, and waves 2 and 4 are smaller retraces of waves 1 and 3.
Corrective waves subdivide into 3 smaller-degree waves, denoted as ABC. Corrective waves start with a five-wave counter-trend impulse (wave A), a retrace (wave B), and another impulse (wave C). The 3 waves A, B, and C make up a larger degree corrective wave (2).In a bear market, the dominant trend is downward, so the pattern is reversed—five waves down and three up.
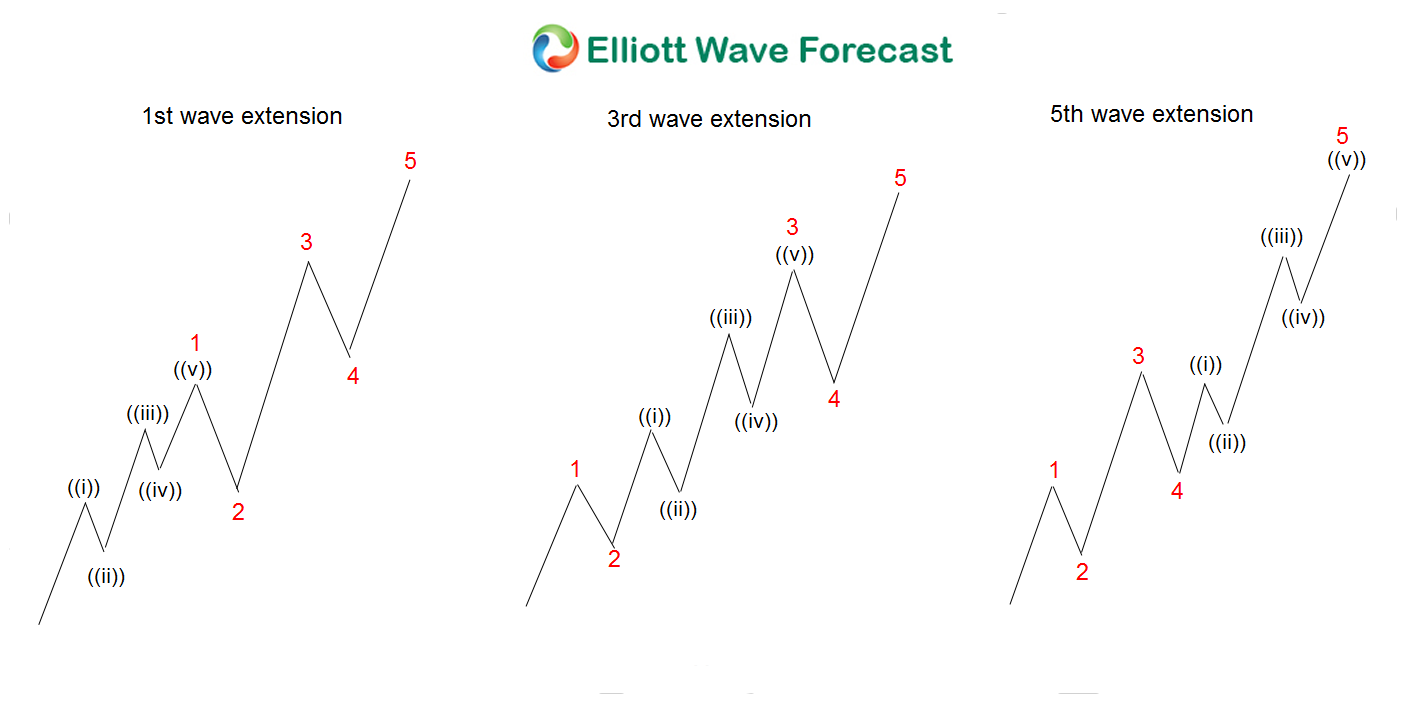
Best Buy is showing a classic advance with the particular difference of a nest since the all-time low. A nest is a series of motive waves that break with the trend most of the time within the powerful wave 3. Out of the three impulses, one of them is always extended which comes with the nest. The following chart shows a nest in the Elliott wave Theory which is exactly what Best Buy did the same the lows at all-time lows.
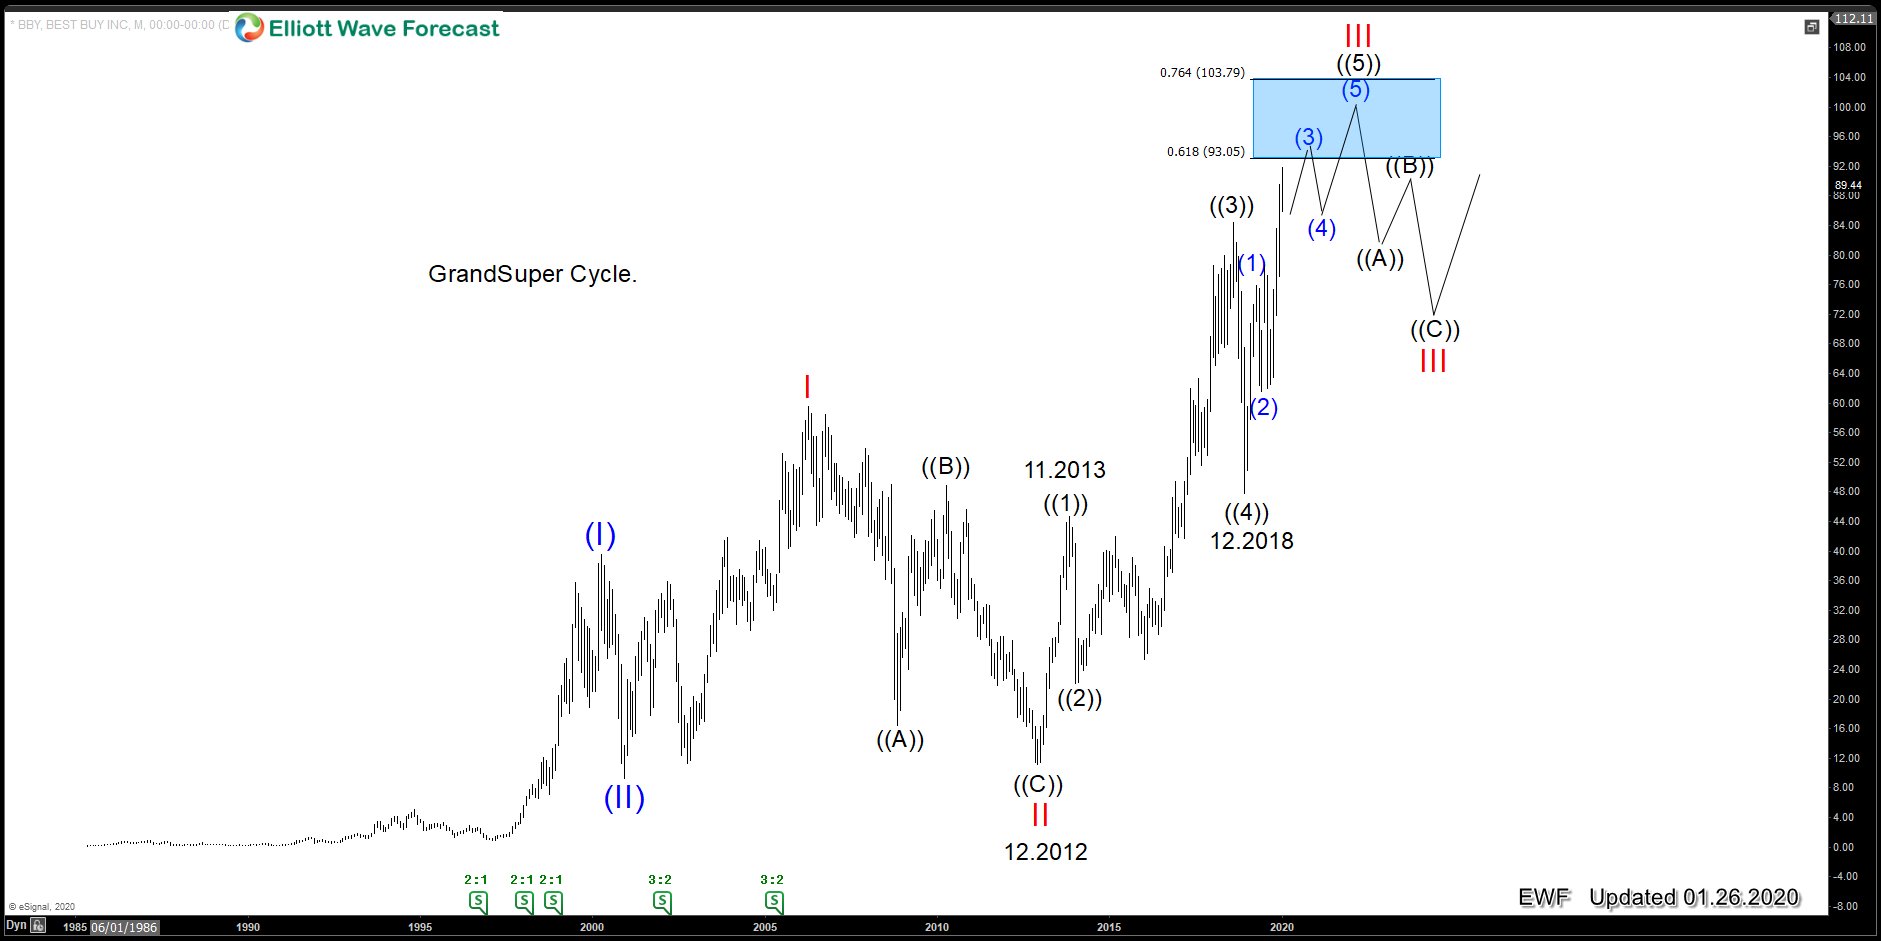
Best Buy rally in three advances of five waves since all-time lows until the peak at 11.2013. Then the instrument pullback and finally managed to see a break to the upside confirming the Impulse or motive advance. Which also supported when the instrument pullback into the 12.2018 low, without overlapping the 11.2013. One of the rules in the Theory is that there must not overlap between wave 1 and 3, then the instrument rally into new highs and created a clear five waves advance since lows at 12.2012. The advance is very clear and Technical and will provide a more long trading opportunity for years to come.
Best Buy Weekly Elliott Wave Chart
Best Buy Daily Elliott Wave Chart
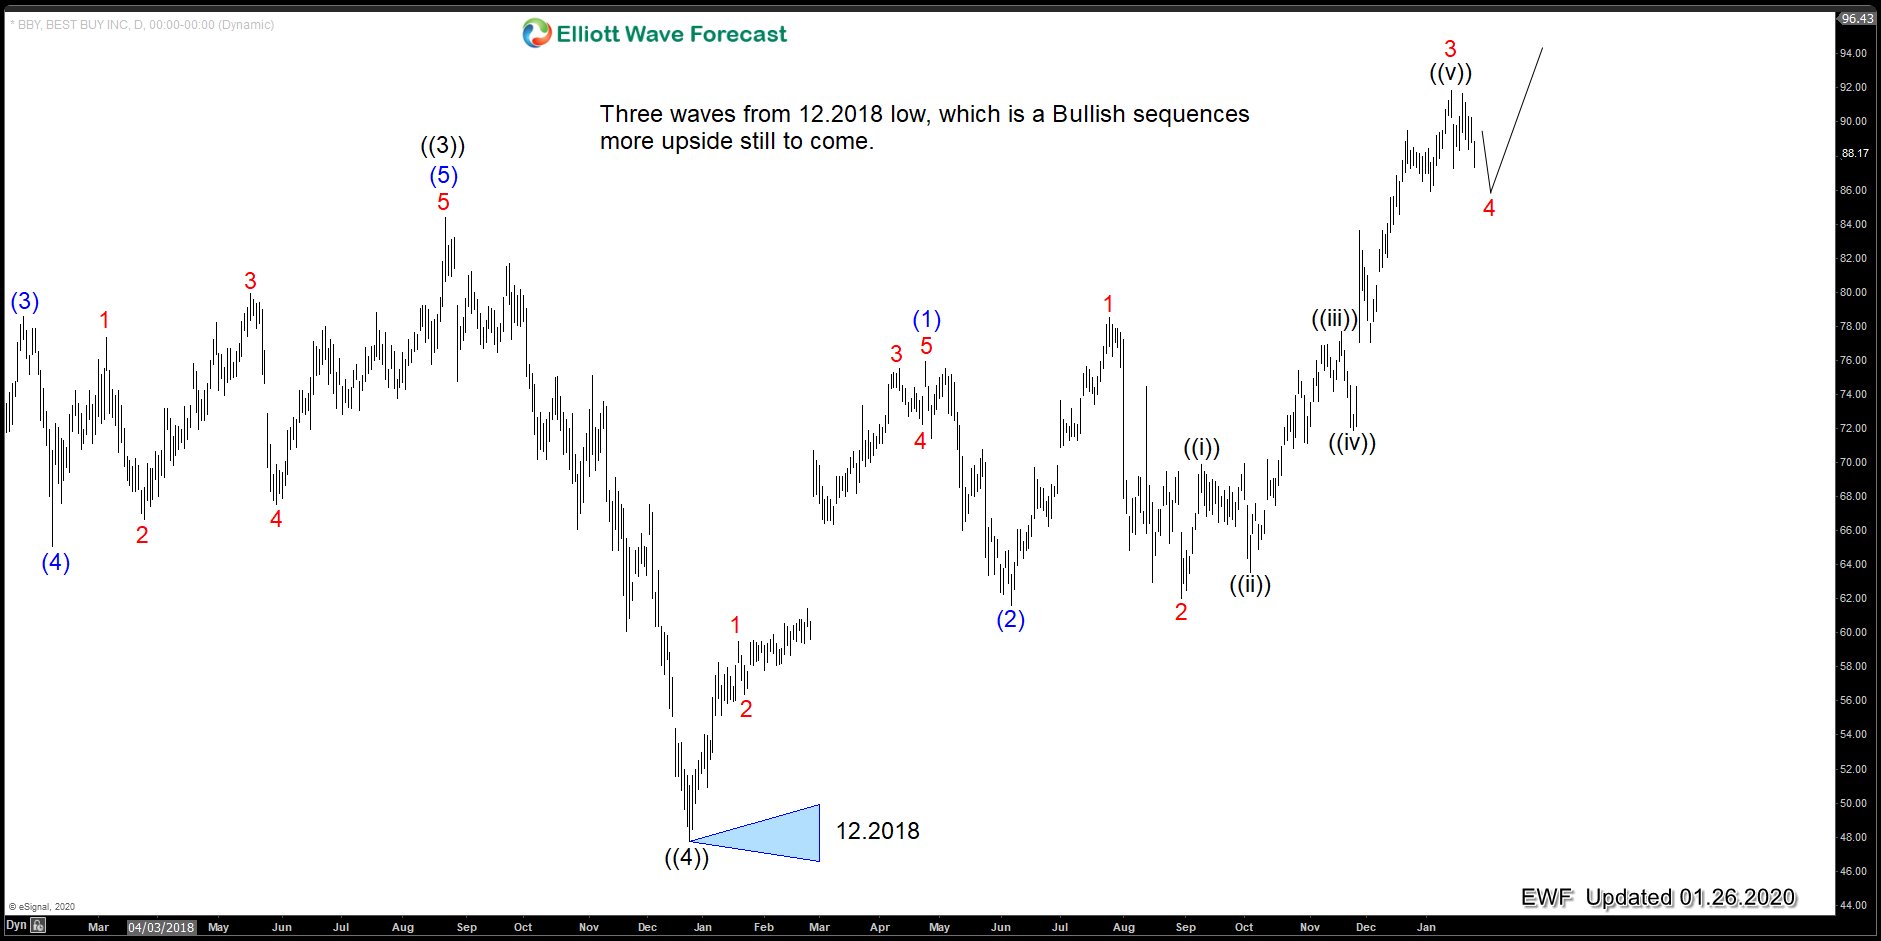
shows the reaction since 12.2018, which is a complete agreement with most of the World Indices, the reaction higher is also impulse and it is not complete yet. We still need to resolve a series of 4-5 since the low, like most World Indices. In the end, understand the Elliott Wave Theory is a beautiful thing, but adding other tools like correlations, sequences, cycles helps to confirm the idea more.