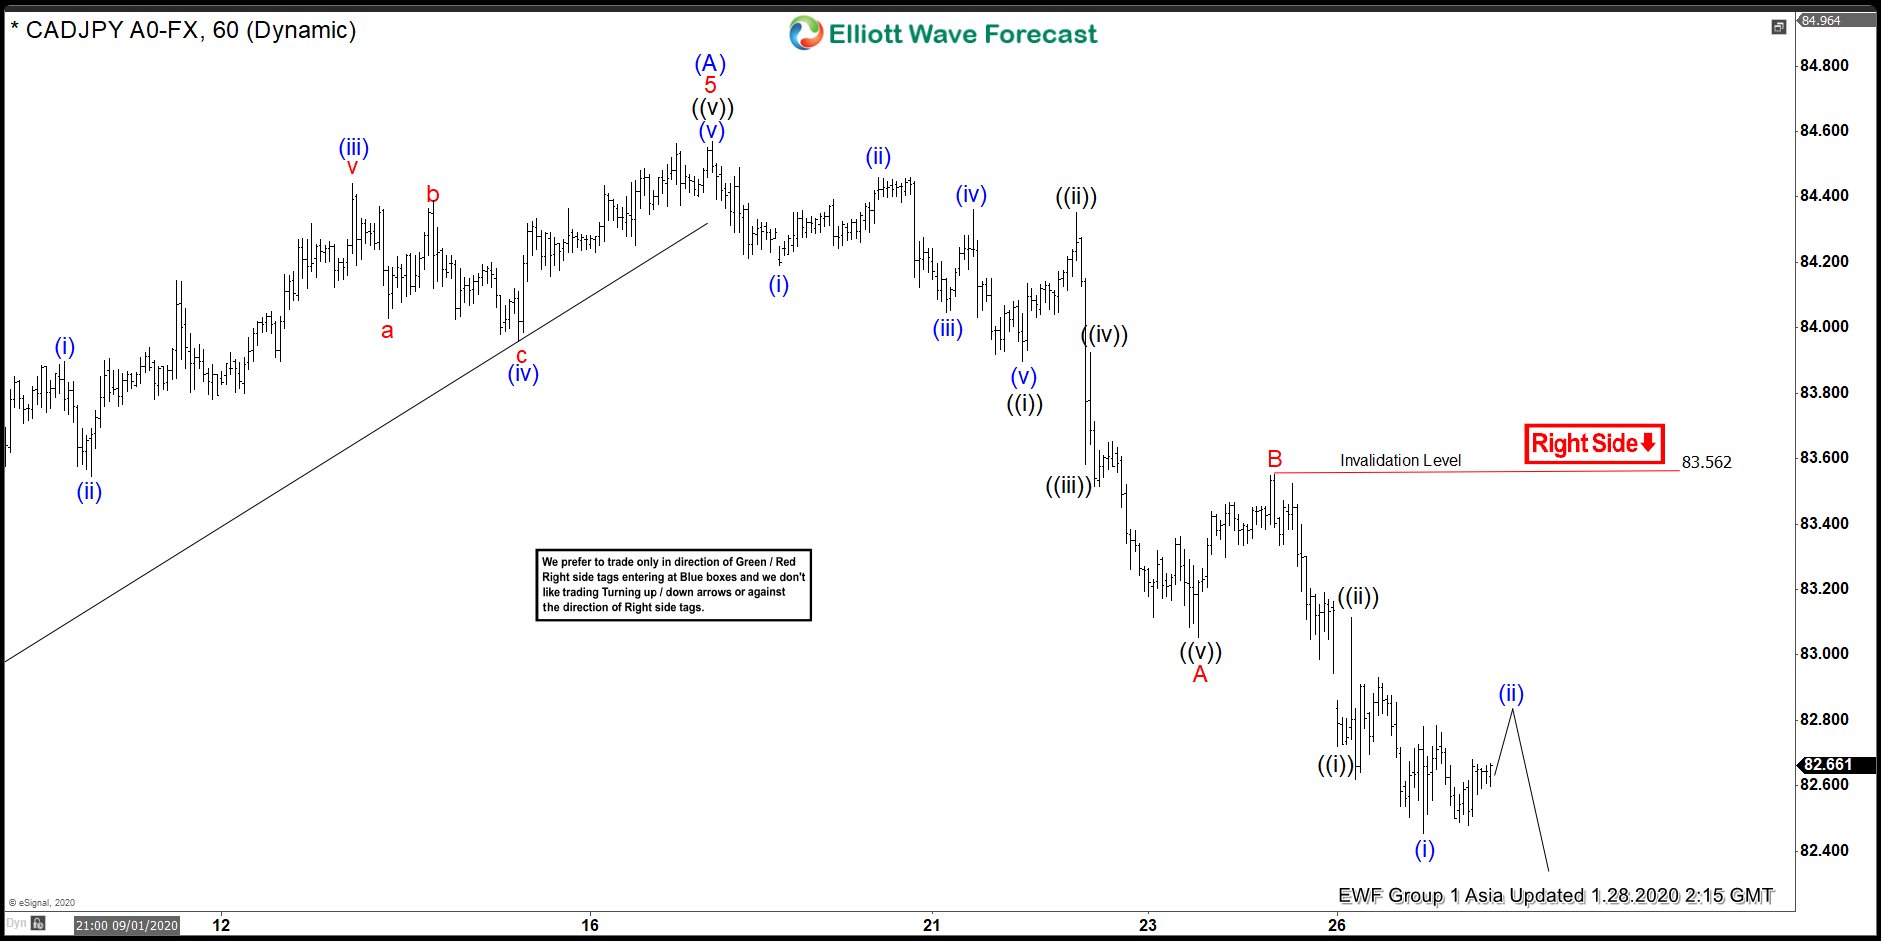
Short term Elliott wave view in CADJPY suggests that the rally from August 25, 2019 low ended 5 waves as a Leading diagonal structure at 84.57 high. Down from there, the pair is correcting that cycle in wave (B) pullback. The internals of that pullback is unfolding as a zigzag structure where wave ((i)) ended at 83.89 low. Wave ((ii)) ended at 84.35 high, wave ((iii)) ended at 83.58 low, wave ((iv)) ended at 83.92 high, wave ((v)) ended at 83.05 low & thus completed wave A lower.
Up from there, wave B bounce has ended at 83.56 high. Below from there, wave C remains in progress as another 5 wave structure. Looking to extend lower towards 82.02-81.05 100%-161.8% Fibonacci extension area of A-B. And should provide an opportunity for bulls to take control again looking for (C) leg higher ideally or for 3 wave reaction higher at least. We prefer a more intraday weakness against 83.56 high. Therefore, bounces should get fail in 3, 7 or 11 swings. While swing traders can be waiting to appear again as soon as the price reaches the 82.02-81.05 area to the downside to going long the pair again.
CADJPY 1 Hour Elliott Wave Chart