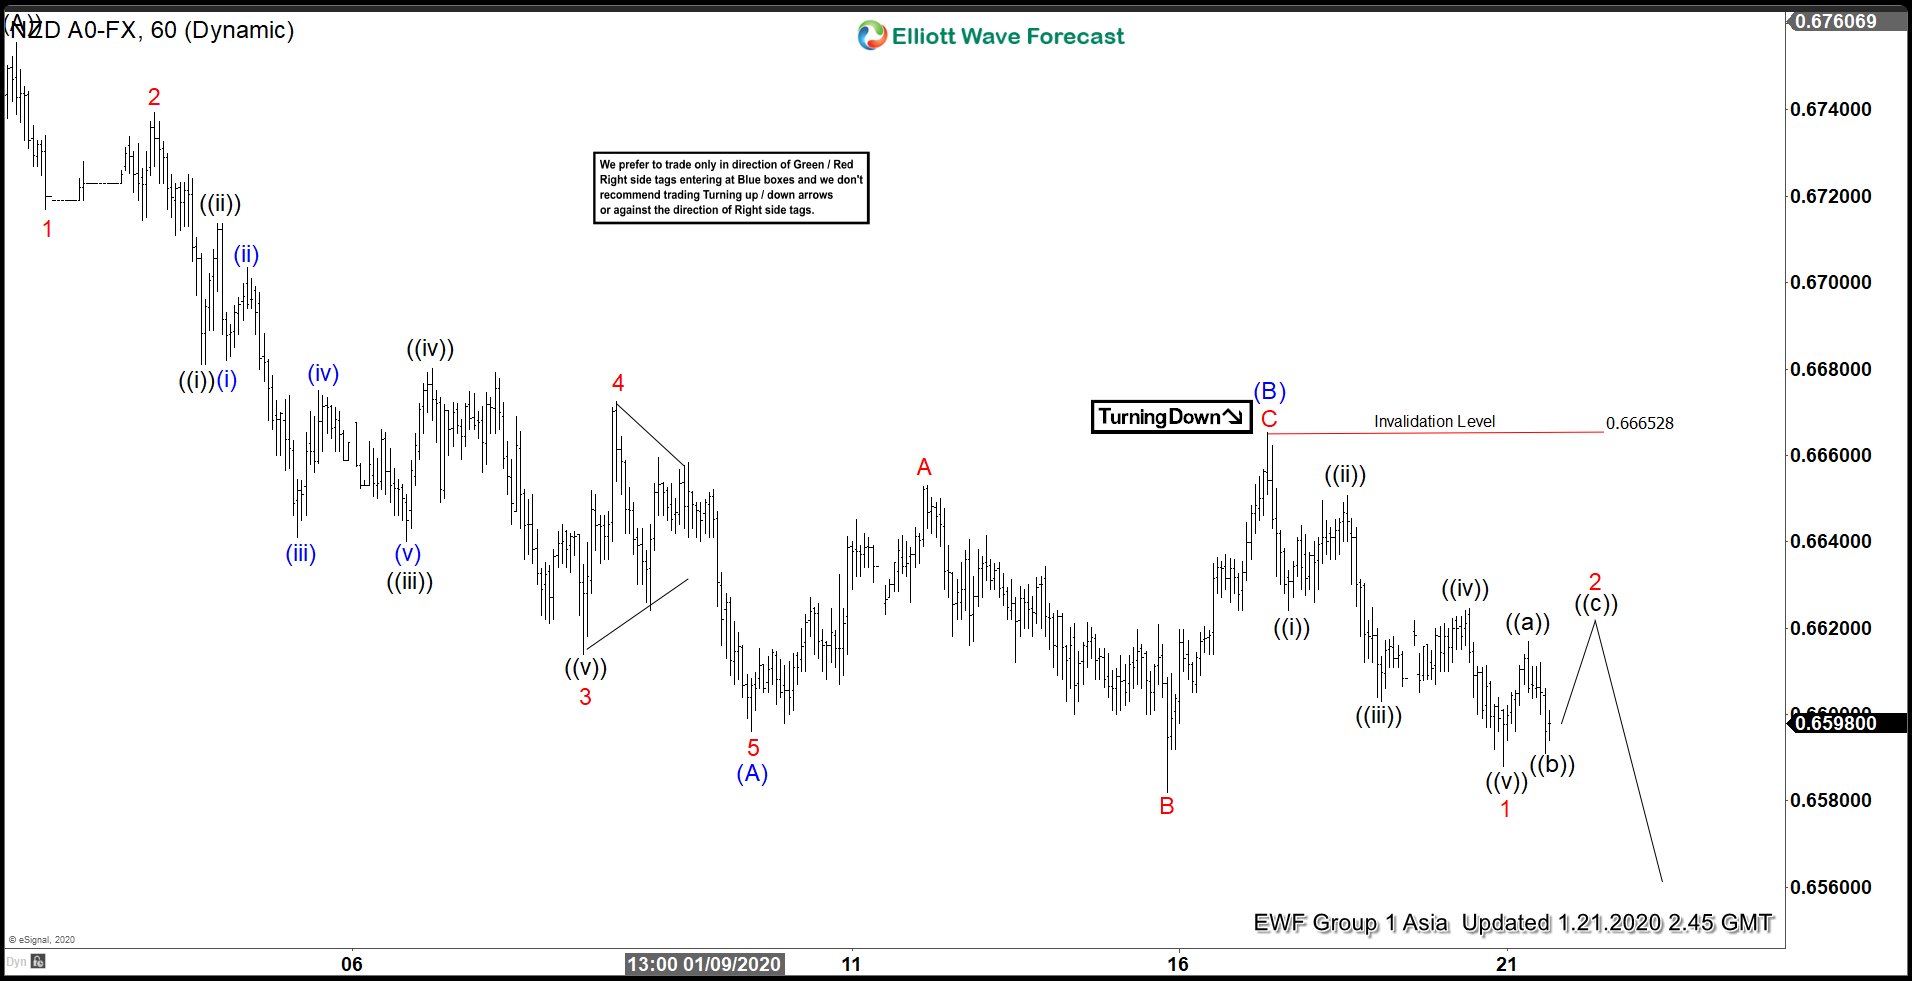
NZDUSD short term Elliott Wave view suggests the decline from 12.31.2019 is unfolding as a zigzag Elliott Wave structure. Down from 12.31.2019 high (0.6755), wave 1 ended at 0.6717, and wave 2 bounce ended at 0.6739. Pair then resumed lower in wave 3 towards 0.6623 with subdivision of another 5 waves of lesser degree. Wave 4 bounce ended at 0.6672. The final wave 5 of (A) ended at 0.6596. Wave (B) bounce is proposed complete at 0.666 with internal subdivision as an expanded Flat.
Wave A of (B) ended at 0.665, wave B of (B) ended at 0.658, and wave C of (B) is complete at 0.666. Pair has turned lower in wave (C) but it needs to break below 0.658 to confirm the bearish sequence in wave (C) and rule out a double correction. Near term, wave 1 of (C) ended at 0.6588. While wave 2 of (C) rally fails below 0.666, expect pair to resume lower again within wave (C). Potential wave (C) target lower is 100% of wave (A)-(B) which comes at 0.646 – 0.65. As far as pivot at 0.666 high stays intact, expect rally to fail in 3, 7, or 11 swing for further downside.
NZDUSD 1 Hour Elliott Wave Chart