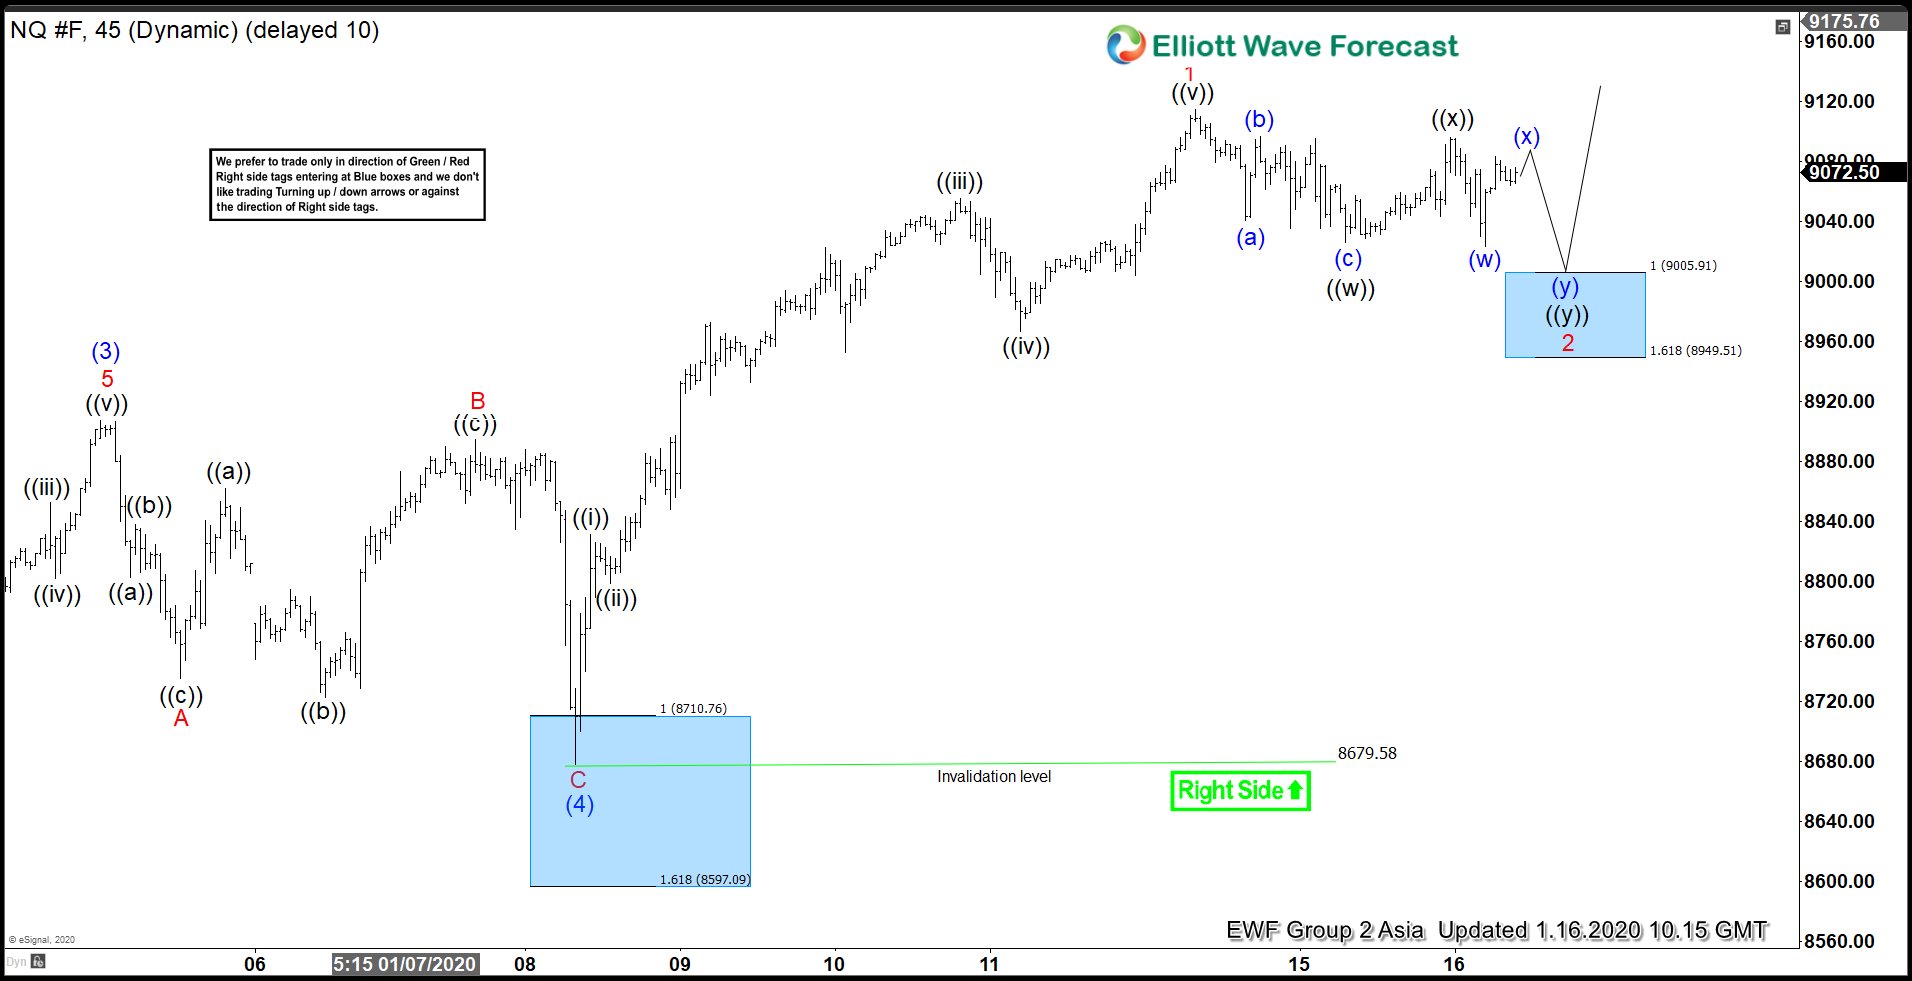
Elliott Wave view on Nasdaq (NQ_F) suggests the rally from October 3, 2019 low is unfolding as a 5 waves impulse Elliott Wave structure. In the 45 minutes chart below, wave (3) of the impulse structure ended at 8907.25. Pullback in wave (4) ended at 8679.58 as a Flat Elliott Wave structure. Wave A of (4) ended at 8735.25, wave B of (4) bounce ended at 8894.75, and wave C of (4) ended at 8679.58. Nasdaq has resumed higher in wave (5) with internal subdivision as 5 waves of lesser degree.
Up from 8679.58, wave ((i)) ended at 8831 and pullback in wave ((ii)) ended at 8679.58. Wave ((iii)) ended at 9055.5 and wave ((iv)) pullback ended at 8966.25. Index then resumed higher and ended wave ((v)) of 1 at 9114.75. It’s currently within wave 2 pullback to correct cycle from January 8, 2020 low before the rally resumes. We don’t like selling the Index and expect dips to find buyers in the sequence of 3, 7, or 11 swing for further upside as far as pivot at 8679.58 low stays intact. Next potential short term support area is 8949.51 – 9005.91 where the Index can end 7 swing double three correction. From this area, Index can extend to new high or bounce in 3 waves at least.
Nasdaq (NQ_F) 1 Hour Elliott Wave Chart