
Advanced Micro Devices INC ($AMD) has been in a tremendous rally since the lows in 2015. The Instrument is rallying within the Grand Supercycle, and the target is between $50.32-$61.81 area. We have been calling this target for the last four years. We did the following blog explaining the idea. At that time, the Instrument was trading around $24.00, but the path was clear to the upside into the $50.32 area against the lows at $1.61. As we always said, the Market does not move in a straight line and always works as a whole. We see the Instrument reaching the target blue box, as the following chart shows:
$AMD Quarterly Elliott Wave Forecast
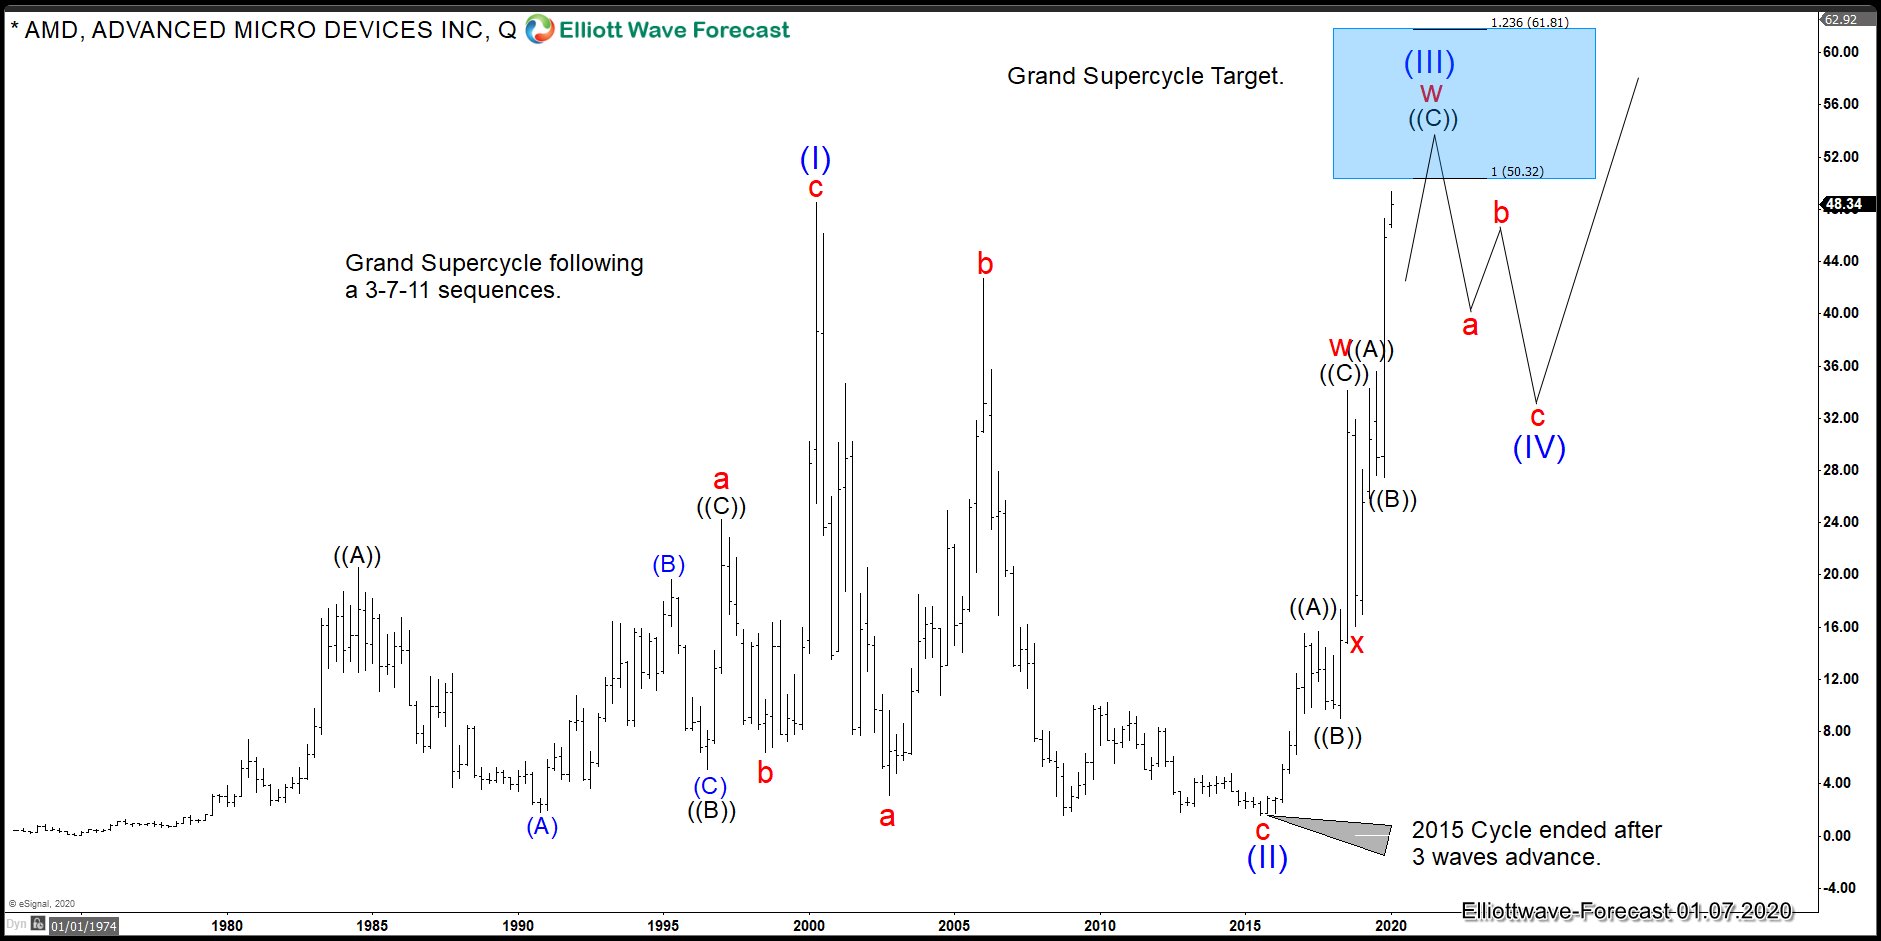
We also see many world indices showing five waves advance since the lows in 2009. This comes in complete agreement and support our view that 2020 will will see the end of the super cycle degree since 2009 lows across the market. $AMD structure, as shown in the chart above, is corrective and overlapping by Nature, which makes us believe it is a Diagonal structure. A diagonal structure comes with 3-3-3-3-3 subdivision. The reason we are labeling is not only based on $AMD, but the overall market forecast. $SPX already passed the 3189 area, which makes the advance within the Super cycle an impulse, as shown in the following chart:
SPX Monthly Elliott Wave Chart
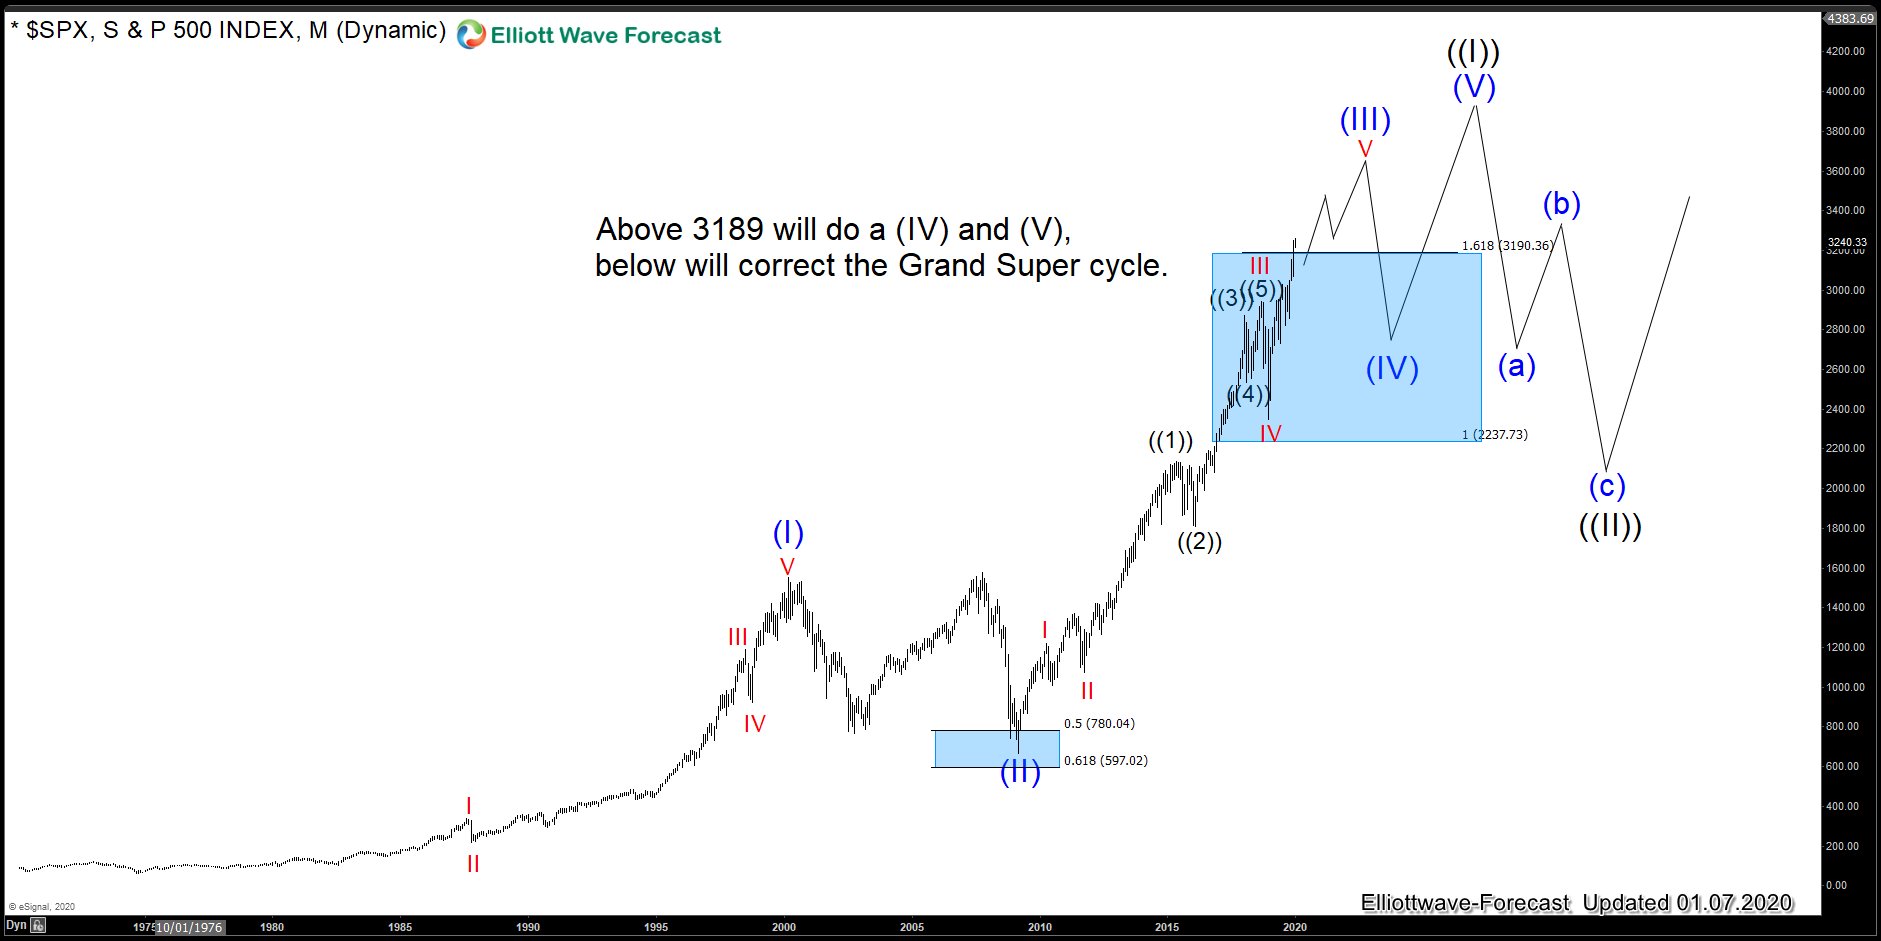
The Impulse in $SPX will make the whole Market oscillate in a series of (IV) and (V). The reason why we use the diagonal structure in $AMD is as a bridge between the Impulse structure of $SPX and the correcting sequences of $AMD. One more time, we make the case that forecasting is more complicated than following just one instrument, but opening your mind and understand that everything is related will make you a better trader.
$AMD should see a decent three waves pullback sometimes this year, most likely by Quarter two or three. The pullback should reach around $36.00-$28.00 area in the future, and will provide another chance to buy.