
In this technical blog, we are going to take a look at the past performance of 10 Year T-Note Futures ticker symbol: $ZN_F 1-Hour Elliott wave Charts that we presented to our members. In which, the rally from November 11, 2019 low ( $127’31) showed a 5 wave impulse structure. Thus suggested that the structure is incomplete to the upside & the $ZN_F should do another 5 waves rally to complete the Elliott Wave zigzag structure. We will explain the Elliott wave structure below:
$ZN_F 1 Hour Elliott Wave Chart From 11.27.2019
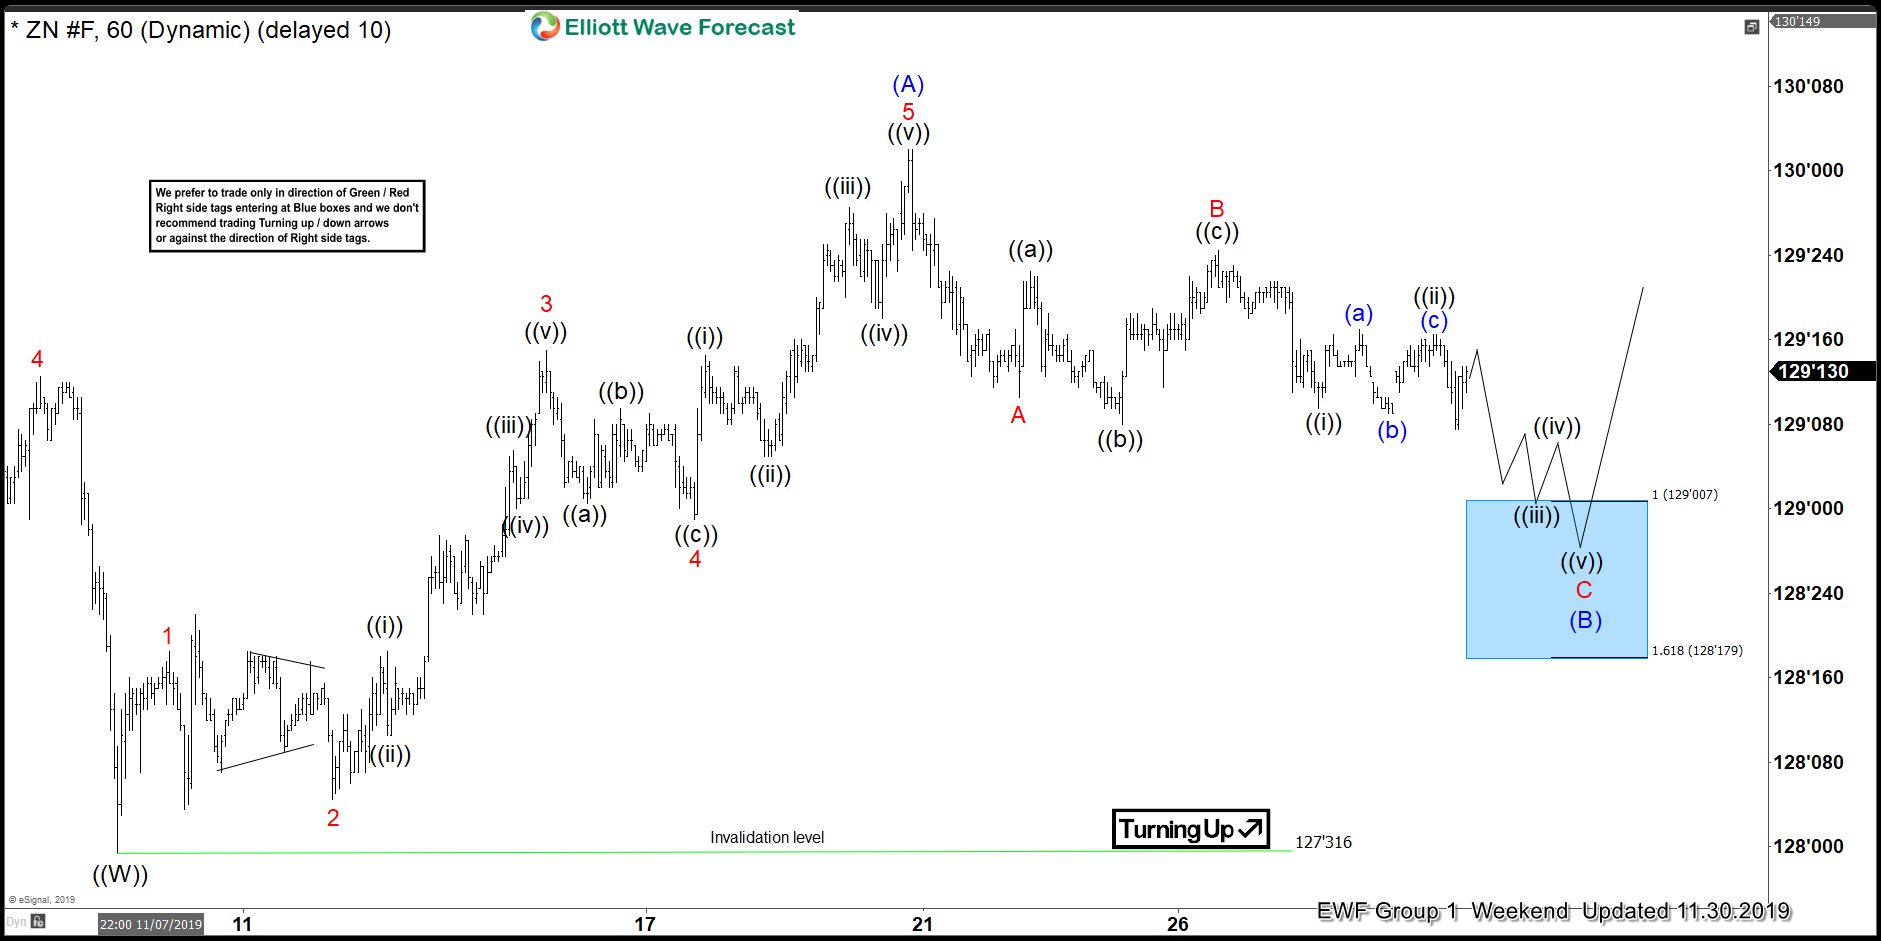
1 Hour Elliott wave Chart from 11/30/2019 London update, in which $ZN_F ended the 5 waves impulse rally in wave (A) at $130’02 high. Down from there, the instrument made a 3 waves pullback in wave (B) to correct the cycle from 11/11/2019 low ( $127’31). The internals of that pullback also unfolded as a lesser degree zigzag structure where wave A ended at $129’10. Wave B ended at $129’24 high. And wave C was expected to reach $129-$128’17 100%-161.8% Fibonacci extension area of A-B. Afterwards, the $ZN_F was expected to see a rally higher in another 5 waves within wave (C) to complete the zigzag structure.
$ZN_F 1 Hour Elliott Wave Chart From 12.04.2019

Here’s 1 hour Elliott Wave Chart from 12/04/2019 London update, in which $ZN_F managed to reach the blue box area i.e $129-$128’17 100%-161.8% Fibonacci extension area of A-B. And got the reaction higher as expected in lesser degree 5 waves impulse structure. Please note that after collecting further data we changed the structure of the wave (B) pullback into a double three structure instead of being zigzag.