Short-term Elliott Wave view in $XAUUSD suggests that the rally from November 12, 2019 low can be nesting higher as an impulse structure looking for more upside still. However, if it continues to see strength higher and see a break above $1529.19 level then the rally could become impulse structure as well. Up from 11/12/2019 low, a rally to $1487 high ended intermediate wave (1) as a leading diagonal structure. Down from there, a 3 wave pullback to $1461.70 low ended intermediate wave (2). Above from there, the metal is showing an impulse rally with extension in lesser degree cycles favoring few more highs to come before a pullback could take place.
Up from $1461.70 low, the initial rally in wave ((i)) unfolded as a leading diagonal structure. Whereas a lesser degree wave (i) ended at $1475.50 high. Wave (ii) ended at $1465.19 low, wave (iii) ended at $149.90 high, wave (iv) ended at $1473.60 low and wave (v) ended at $1480.50 high. Down from there, the pullback in wave ((ii)) unfolded as a zigzag structure where wave (a) ended at $1474 low. Wave (b) ended at $1479.26 high and wave (c) ended at $1470.19 low.
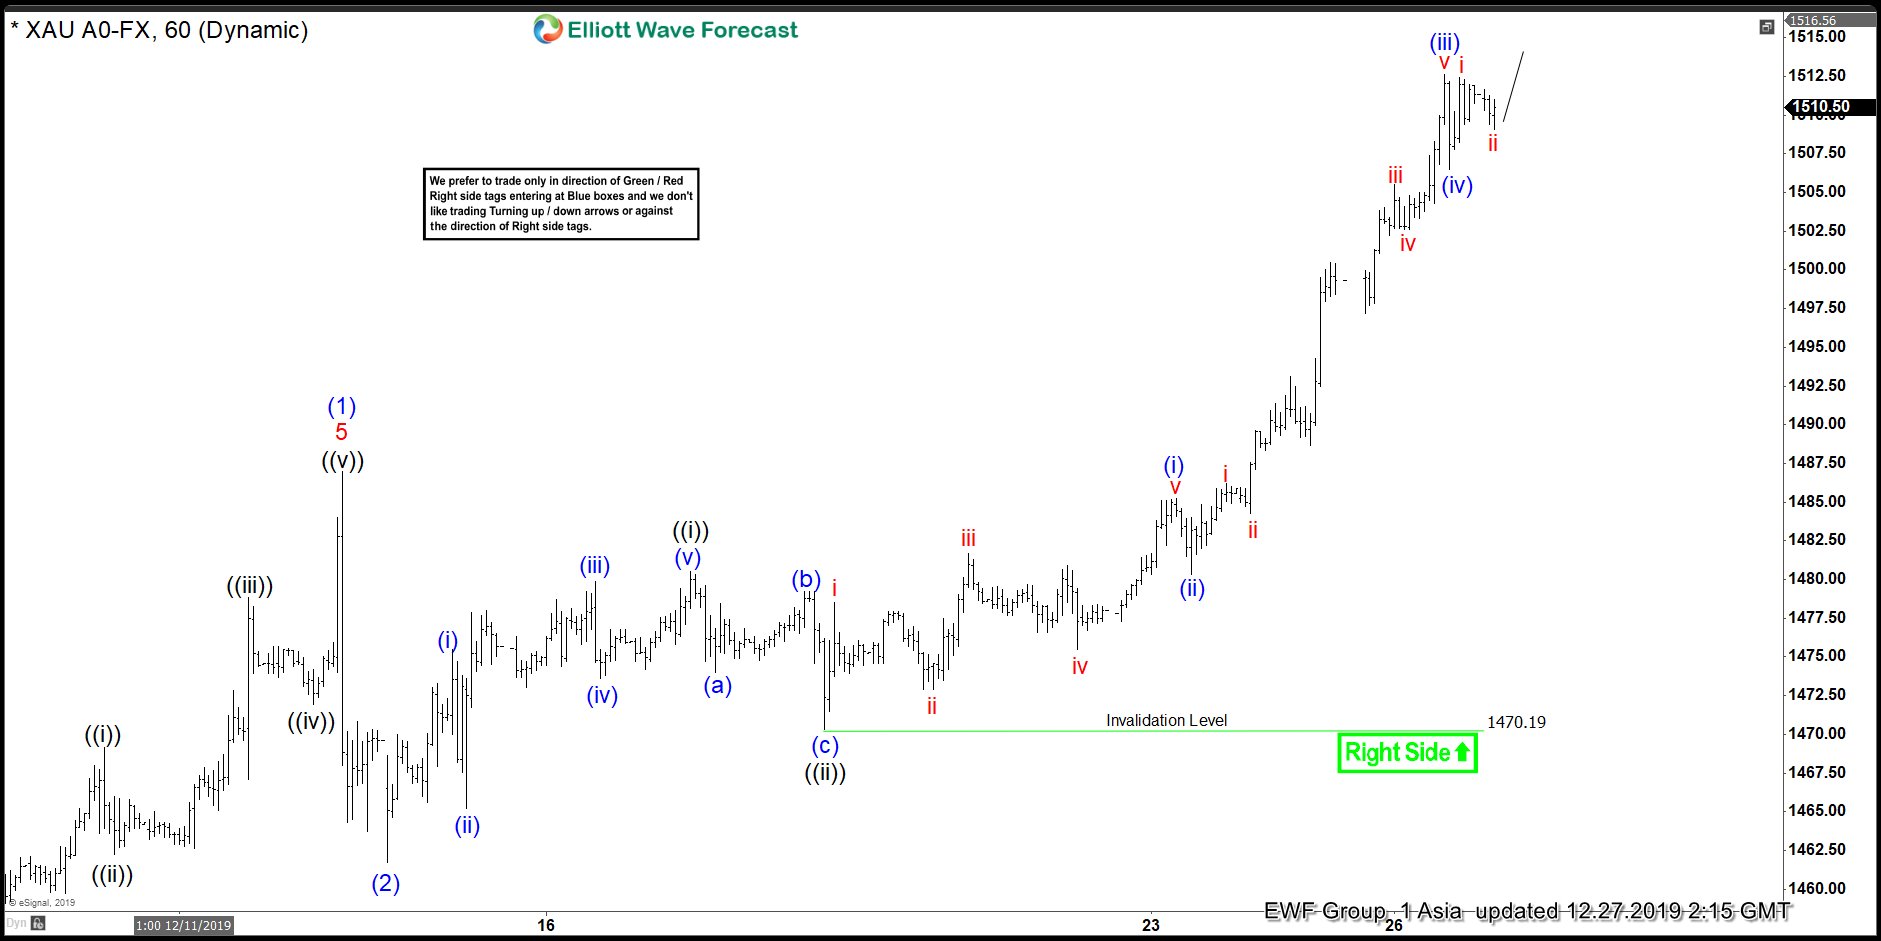
Above from there, wave ((iii)) is unfolding as impulse structure where lesser degree wave (i) ended at $1485.21 high. Wave (ii) ended at $1480.30 low, wave (iii) ended at $1512.60 low and wave (iv) ended at $1506.50 low. Near-term, the metal can be looking to extend higher towards $1521.40-$1524.90 (v)=(i) target area before a rally from December 18, 2019 low ( $1470.19) ends in wave ((iii)). And a pullback in wave ((iv)) could develop in 3, 7 or 11 swings before more upside can be seen. We don’t like selling the metal and expect more upside to take place as far as a pivot from $1470.19 low stays intact.
$XAUUSD 1 Hour Elliott Wave Chart