In this technical blog we’re going to take a quick look at the Elliott Wave charts of NIKKEI published in the membership area of the elliottwave-forecast . As our members know, NIKKEI ended cycle from the 22427 low as 5 waves structure. We got 3 waves pull back , when the price reached Equal Legs – Blue Box. NIKKEI found buyers at that area as we expected. In further text we’re going to explain Elliott Wave Forecast.
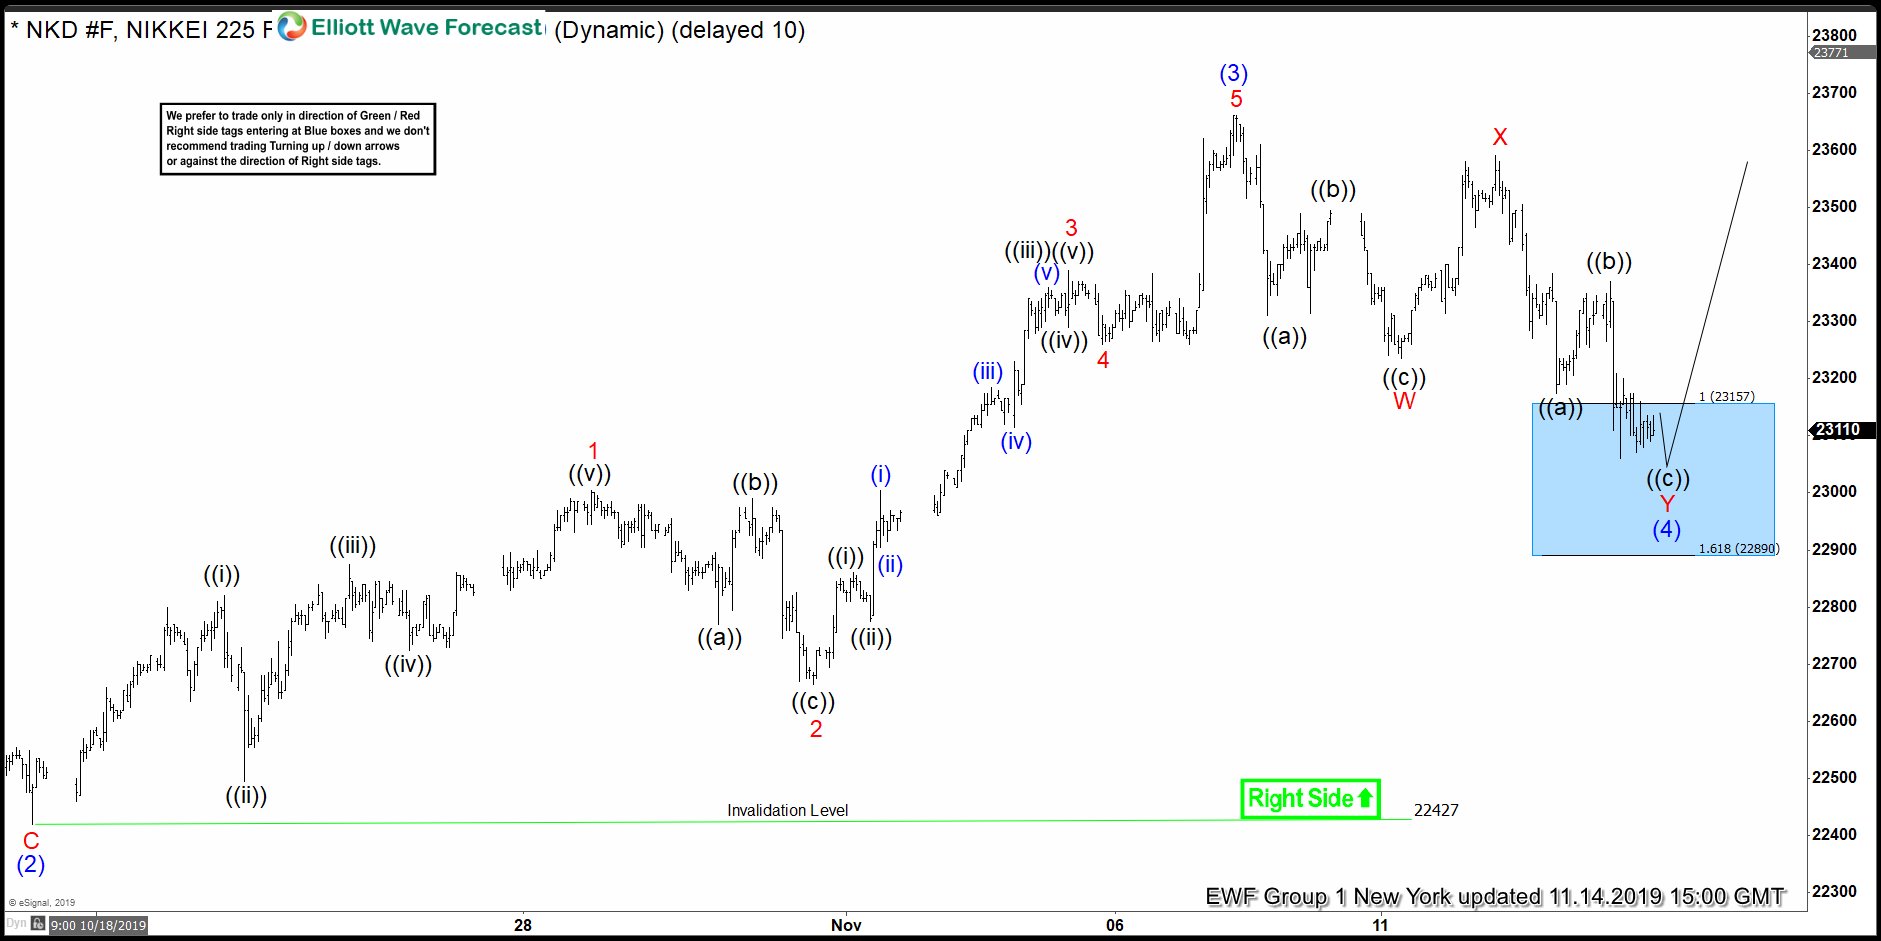
NIKKEI 1 Hour Elliott Wave Analysis 11.14.2019
NIKKEI is correcting the cycle from the 22427 low, when Pull back is unfolding as Elliott Wave Double Three Pattern. We can count clear 7 swings down from the peak when the price has already reached the equal legs- Blue Box area. We don’t have any clear sign yet that pull back is done, but we are aware that turn can happen any moment . As our members know, Blue Boxes are no enemy areas , giving us 85% chance to get a reaction from there. We expected buyers to appear at the blue box for a proposed rally or 3 waves bounce alternatively and extend lower to continue correcting cycle from 10/3 low. We advise members to avoid selling against the main bullish trend and expect rally to happen from the blue box in 3 waves bounce at least.
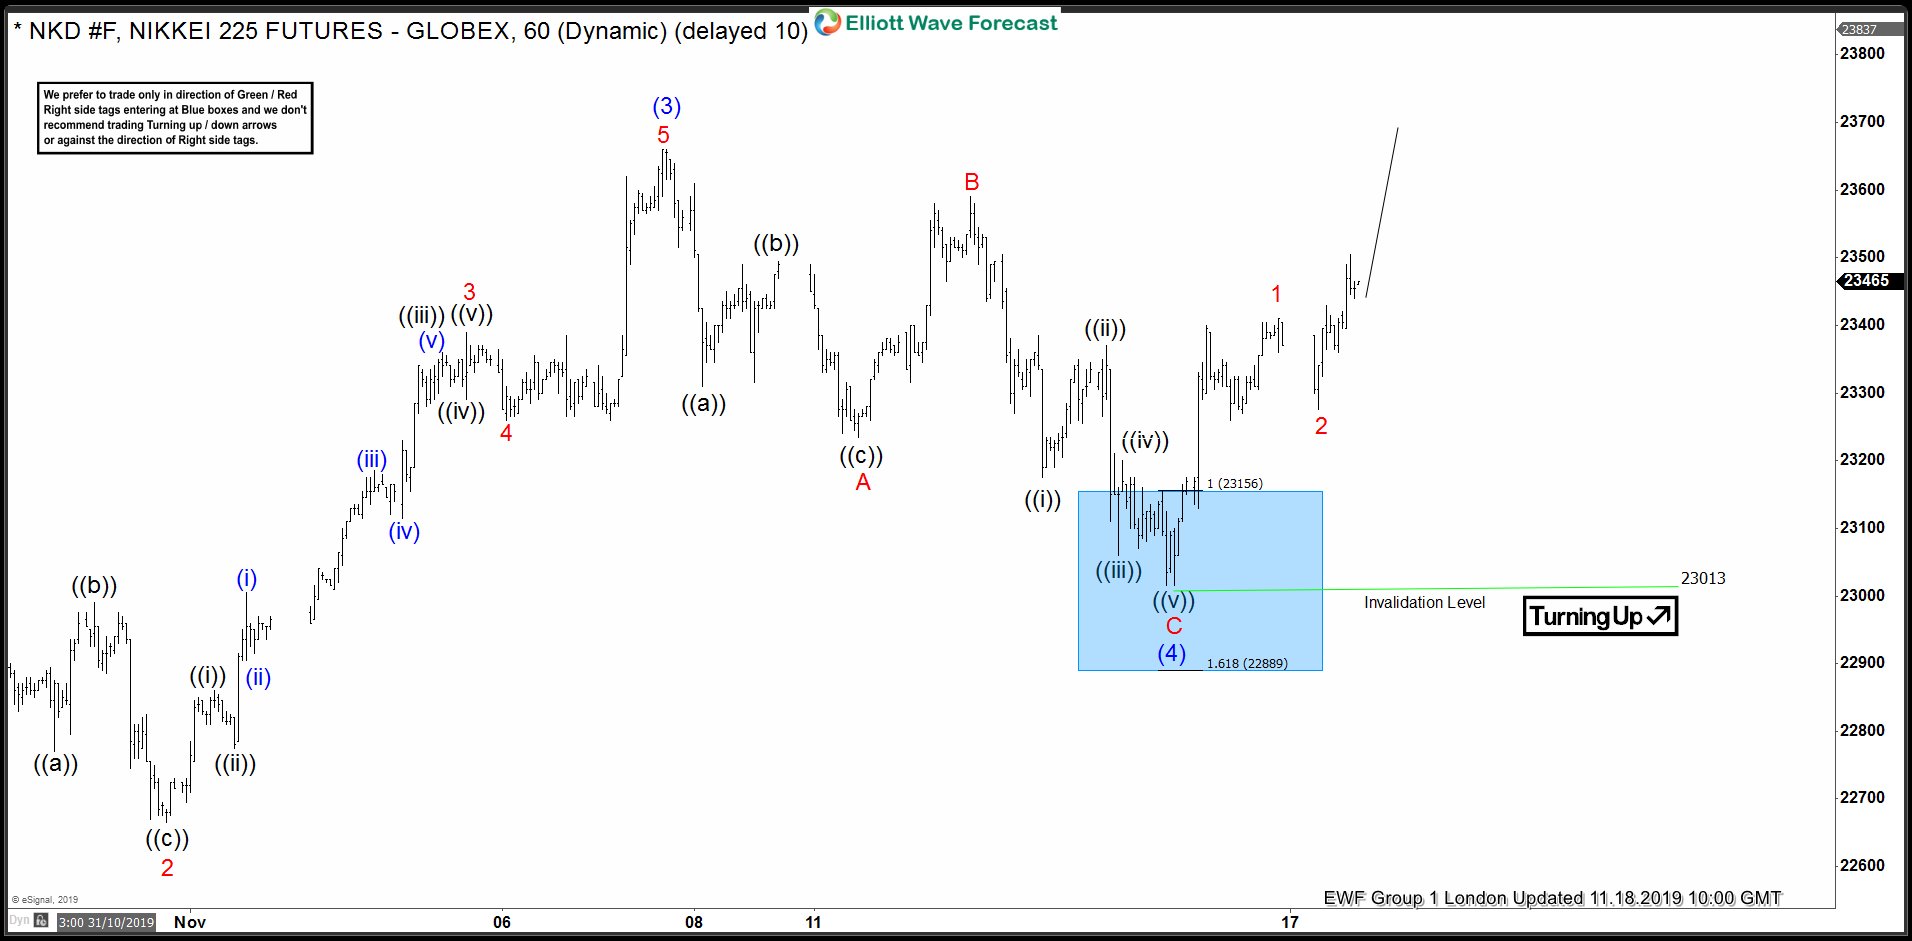
NIKKEI 1 Hour Elliott Wave Analysis 11.18.2019
NIKKEI found buyers right at the blue box area. We are getting nice reaction from there so far. At this stage we are calling wave (4) blue pull back completed as Flat Pattern. We would like to see further extension higher and break above 11/07 high to confirm next leg up is in progress. Otherwise break below 23013 low would open possibility for a deeper correction.
Keep in mind market is dynamic and presented view could have changed in the mean time. You can check most recent charts in the membership area of the site. Best instruments to trade are those having incomplete bullish or bearish swings sequences.