
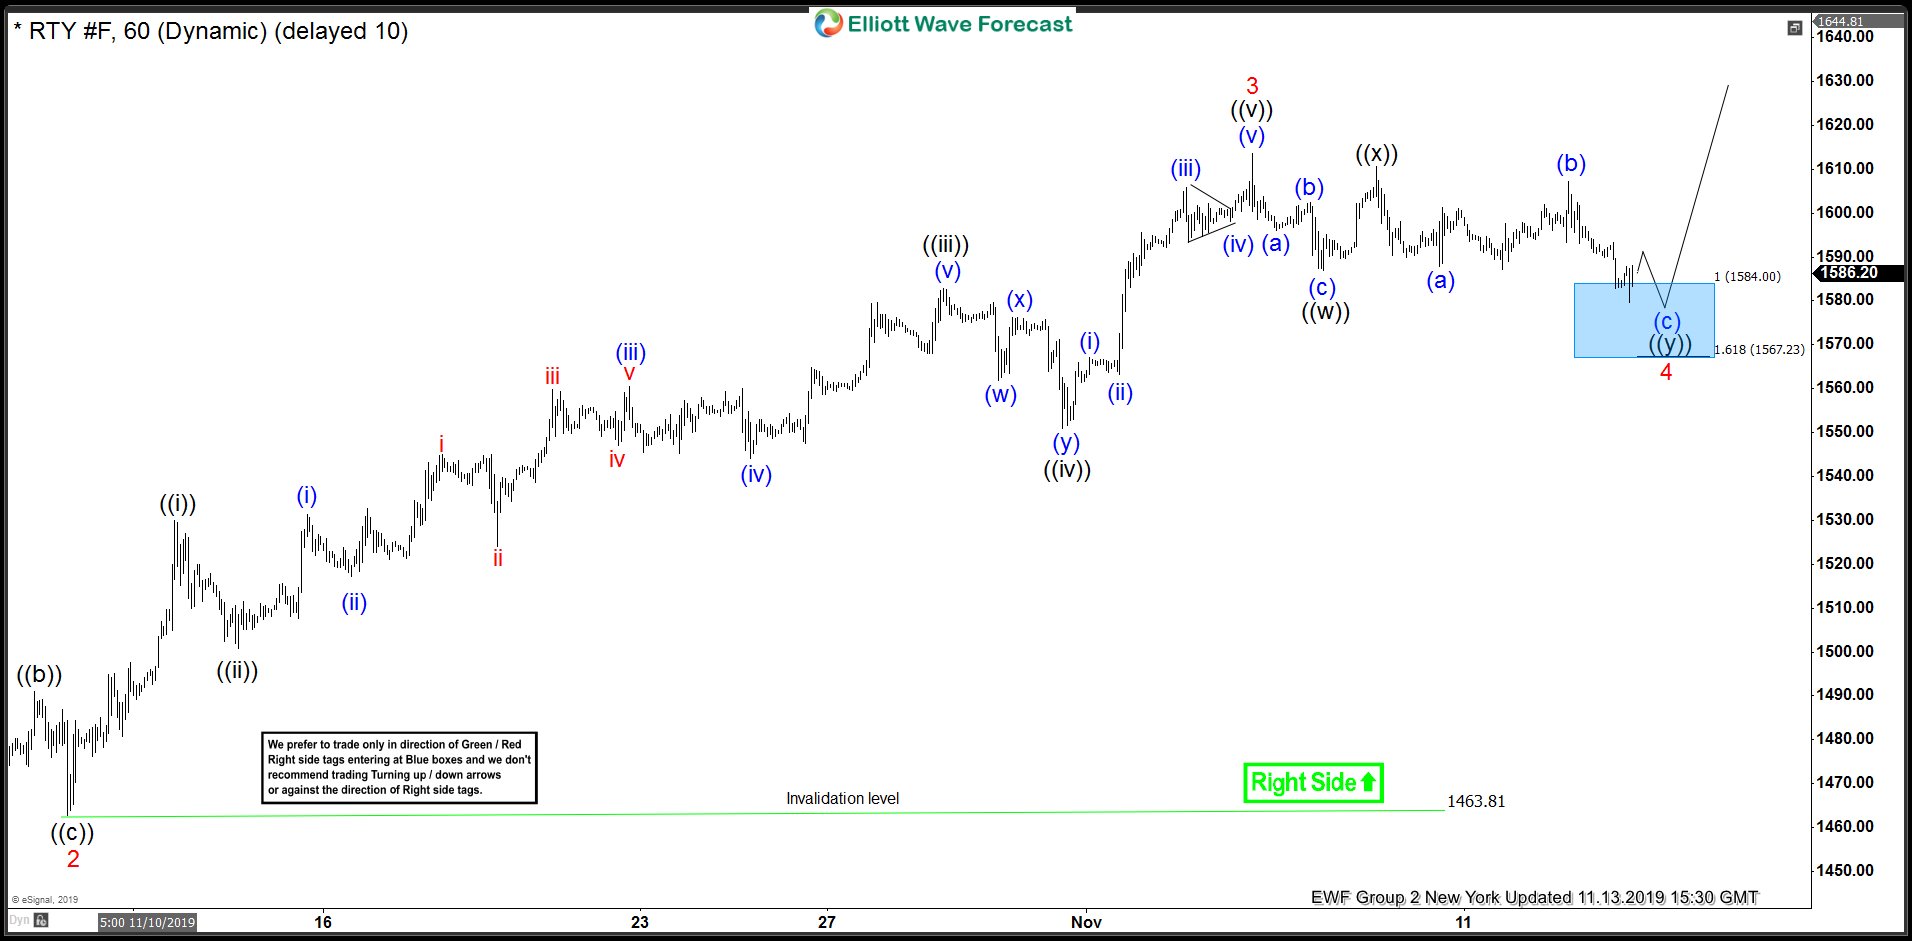
Elliott Wave View on Russell index suggests that the rally from 10/03/2019 low is unfolding as a 5 waves impulse structure favoring more upside to take place. While above 10/03/2019 low, wave 1 ended at $1510.7 high and a pullback in wave 2 ended at $1463.8 low. Index has extended higher in wave 3 with the subdivision of another 5 waves in lesser degree cycles where wave ((i)) ended at $1530 high. Wave ((ii)) pullback ended at $1500.8 low, wave ((iii)) ended at $1582.9 high and wave ((iv)) ended at $1551 low. Up from there, a rally to $1613.6 high ended wave ((v)) and also completed wave 3 in red.
Down from there, the pullback in wave 4 is taking place to correct the rally from 10/09/2019 low ( $1463.8). The internals of that pullback are unfolding as double three structure where wave ((w)) ended at $1586.9 low. Wave ((x)) bounce ended at $1610.6 high and wave ((y)) has managed to reach the $1584-$1567.2 100%-161.8% Fibonacci extension area of ((w))-((x)). Thus suggesting that as far as a pivot from $1463.8 low stays intact, soon index is expected to find buyers looking for more upside or should do a 3 wave bounce at least. Alternatively, the pullback from the peak could become a Flat structure as well & may do 2 more lows within the blue box area before resuming higher. We don’t like selling the index in a proposed pullback.