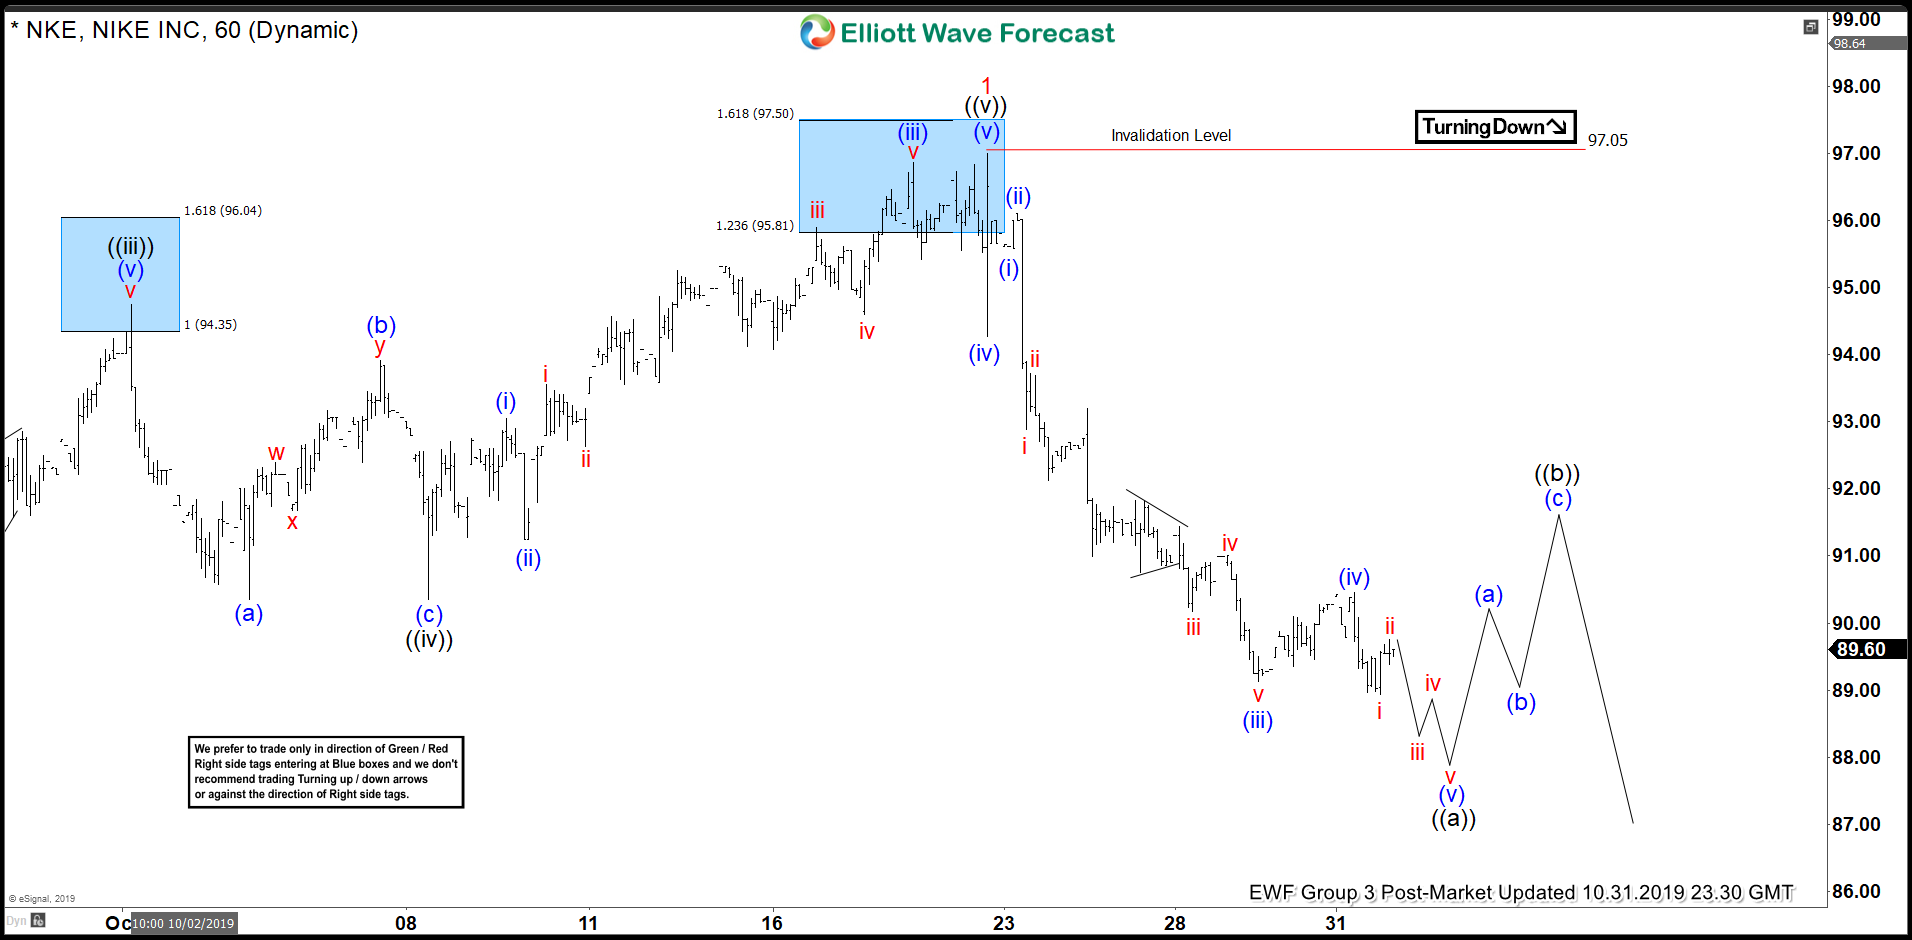
Short Term Elliott Wave view on Nike suggests the rally to $97.05 on October 23, 2019 high ended wave 1. This rally started from August 6, 2019 low (77.5) as a 5 waves impulse Elliott Wave structure. On the chart below, we can see wave ((iii)) of this impulsive rally ended at 94.75. Wave ((iv)) pullback ended at 90.35 as a zigzag Elliott Wave structure. The stock then rallied to 97.05 to end wave ((v)) of 1. From there, it’s pulling back in wave 2 to correct the rally from August 6, 2019 low.
The structure of wave 2 pullback is unfolding as a zigzag Elliott Wave structure where we are now ending wave ((a)) of this zigzag. Internal of wave ((a)) is unfolding as a 5 waves impulse. Down from 97.05, wave (i) ended at 95.58, and wave (ii) rally ended at 96.10. The stock then extended lower in wave (iii) towards 89.13 with internal subdivision as 5 waves in lesser degree. From there, wave (iv) bounce ended at 90.45. Wave (v) lower is currently in progress and expected to end soon. The 5 waves move lower will end wave ((a)) of 2. The stock should then bounce in wave ((b)) of 2 to correct cycle from October 23, 2019 high before the decline resumes in wave ((c)). As far as pivot at 97.05 high stays intact, we expect rally to fail in 3, 7, or 11 swing and stock to resume lower again.
Nike 1 Hour Elliott Wave Chart