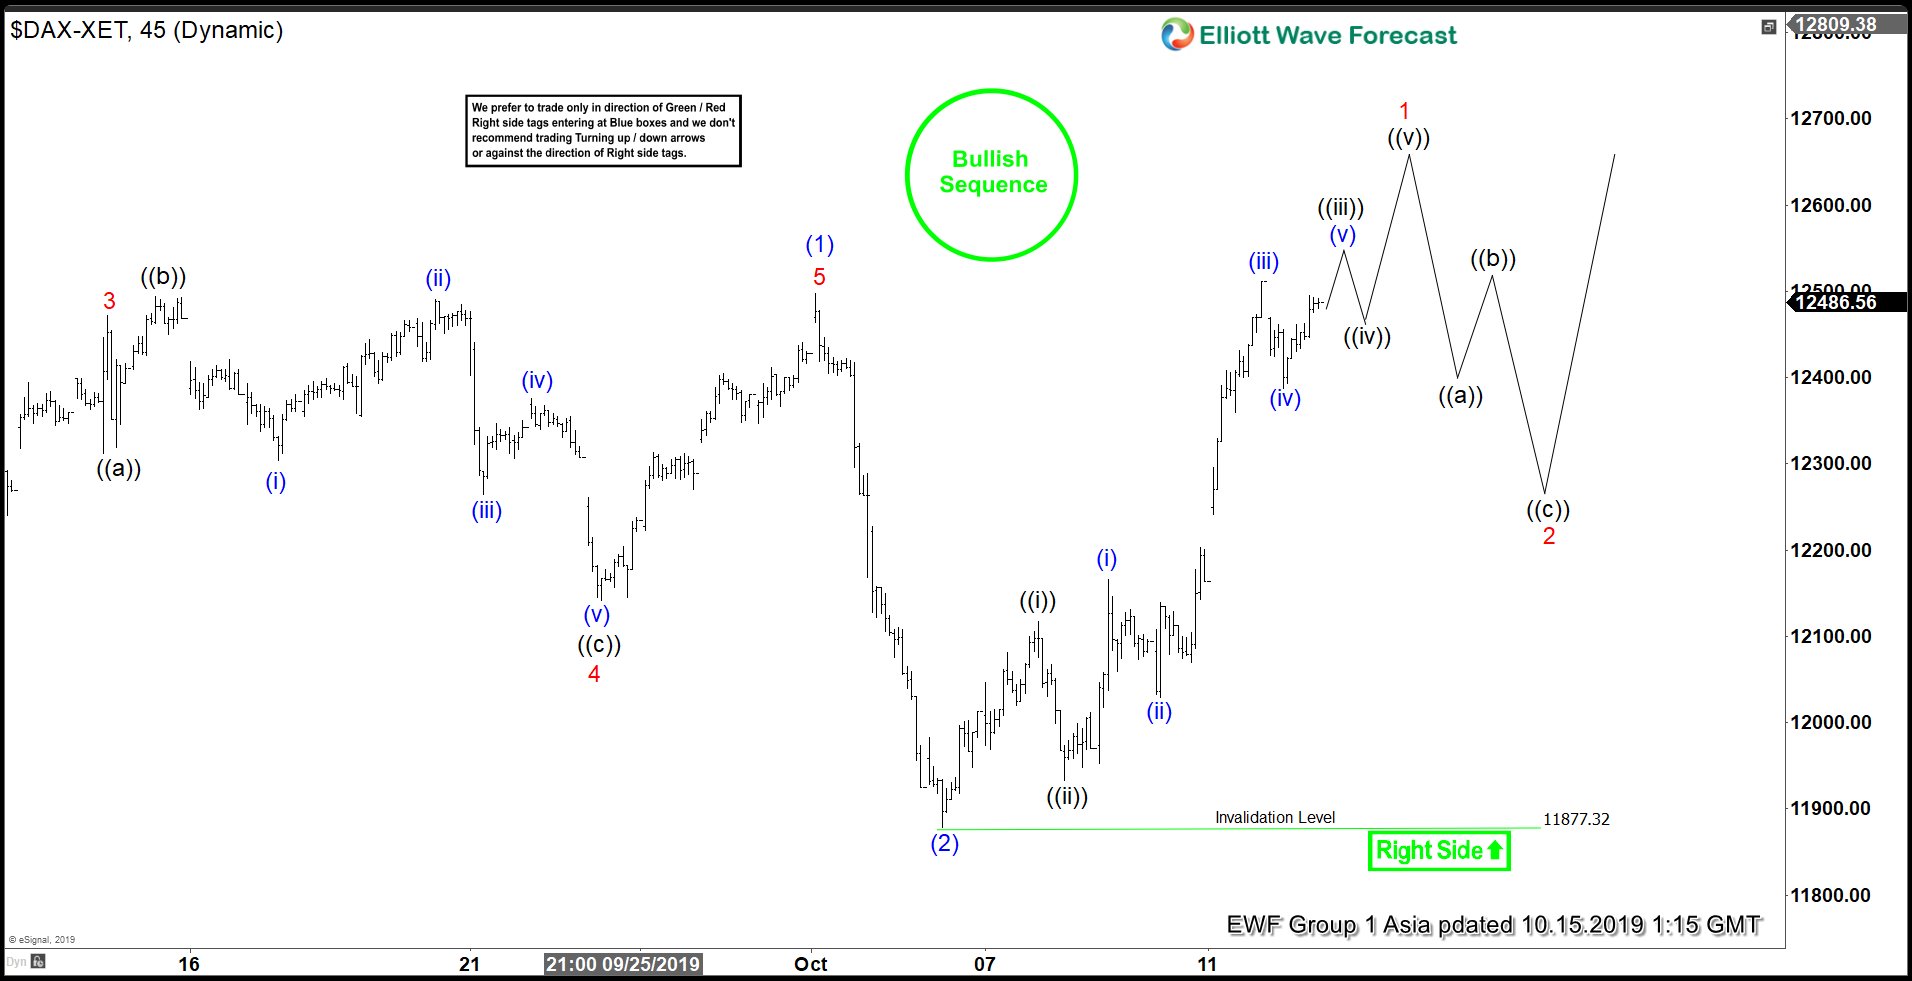
DAX shows Elliott Wave bullish sequence from August 15, 2019 low (11266.48) favoring more upside. The rally from 11266.48 to 12497.28 ended wave (1) as a 5 waves impulse Elliott Wave structure. On the chart below, we can see wave 3 of (1) ended at 12471.83, wave 4 of (1) ended at 12141.82, and wave 5 of (1) ended at 12497.28. Index then pullback in wave (2) and ended the correction at 11877.32.
Index has resumed higher and broken above wave (1) at 12497.28, signalling the next move higher has started. Up from 11877.32, wave ((i)) ended at 12097.43 and wave ((ii)) ended at 11933.02. Expect Index to see a few more highs before ending wave 1 of (3) a 5 waves from 11877.32. Index should then pullback in wave 2 to correct cycle from October 4 low (11877.32) in 3, 7, or 11 swing before the rally resumes. We don’t like selling the Index.
DAX 1 Hour Elliott Wave Chart


