
Last week, there was anticipation of market volatility as the Fed’s Chairman Jerome Powell was scheduled to speak at Jackson Hole. President Trump and China however stole the show. China introduced fresh retaliatory tariffs on $75 billion of U.S. imports, targeting politically sensitive products. President Trump immediately responded. Trump announced in twitter the existing 25% tariffs on $250 billion Chinese goods will rise to 30% on October 1. In addition, the 10% tariffs on another $300 billion Chinese Goods will rise to 15% instead on September 1.
In a series of Tweet storm, Trump also accused Powell of a bigger enemy than China’s President Xi Jinping and issued an order to American companies to get out of China.
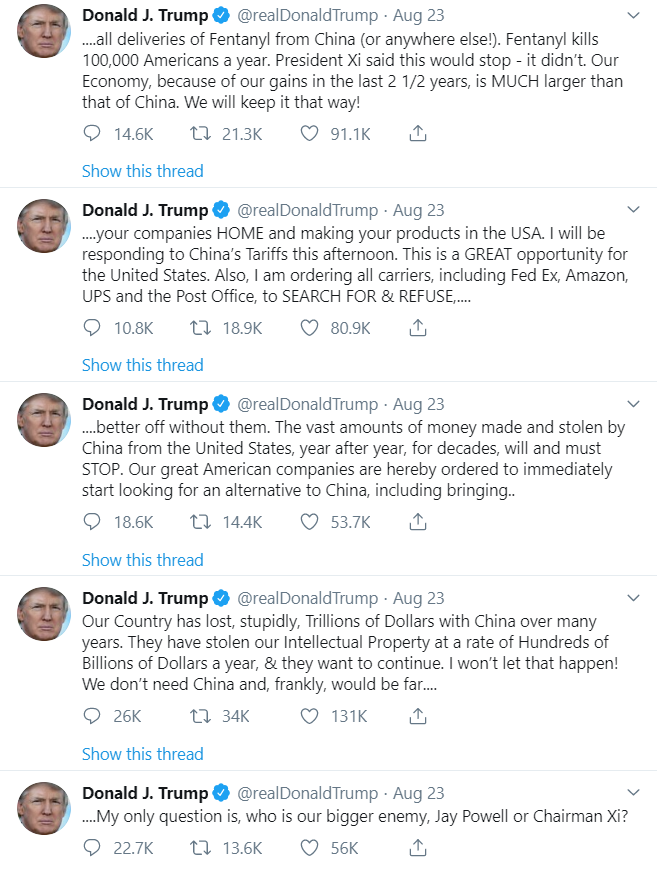
“Our great American companies are hereby ordered to immediately start looking for an alternative to China, including bringing your companies HOME and making your products in the USA,” Trump wrote. The move came after the market closed and before Trump departs to G7 summit in France. The National Retail Federation issued a statement on Friday saying that the tariffs approach is not working.
On Sunday at the G7 summit however, President Trump said that he has a second thought on escalating the trade war with China. The G-7 leaders seem to have successfully nudged the President gently to dial down his aggressive stance against China. It remains to be seen if Trump withdraws his threats last Friday, whether fully or partially. In the meantime, one thing for certain is that the market will continue to be uncertain and volatile.
S&P 500 Longer Term View
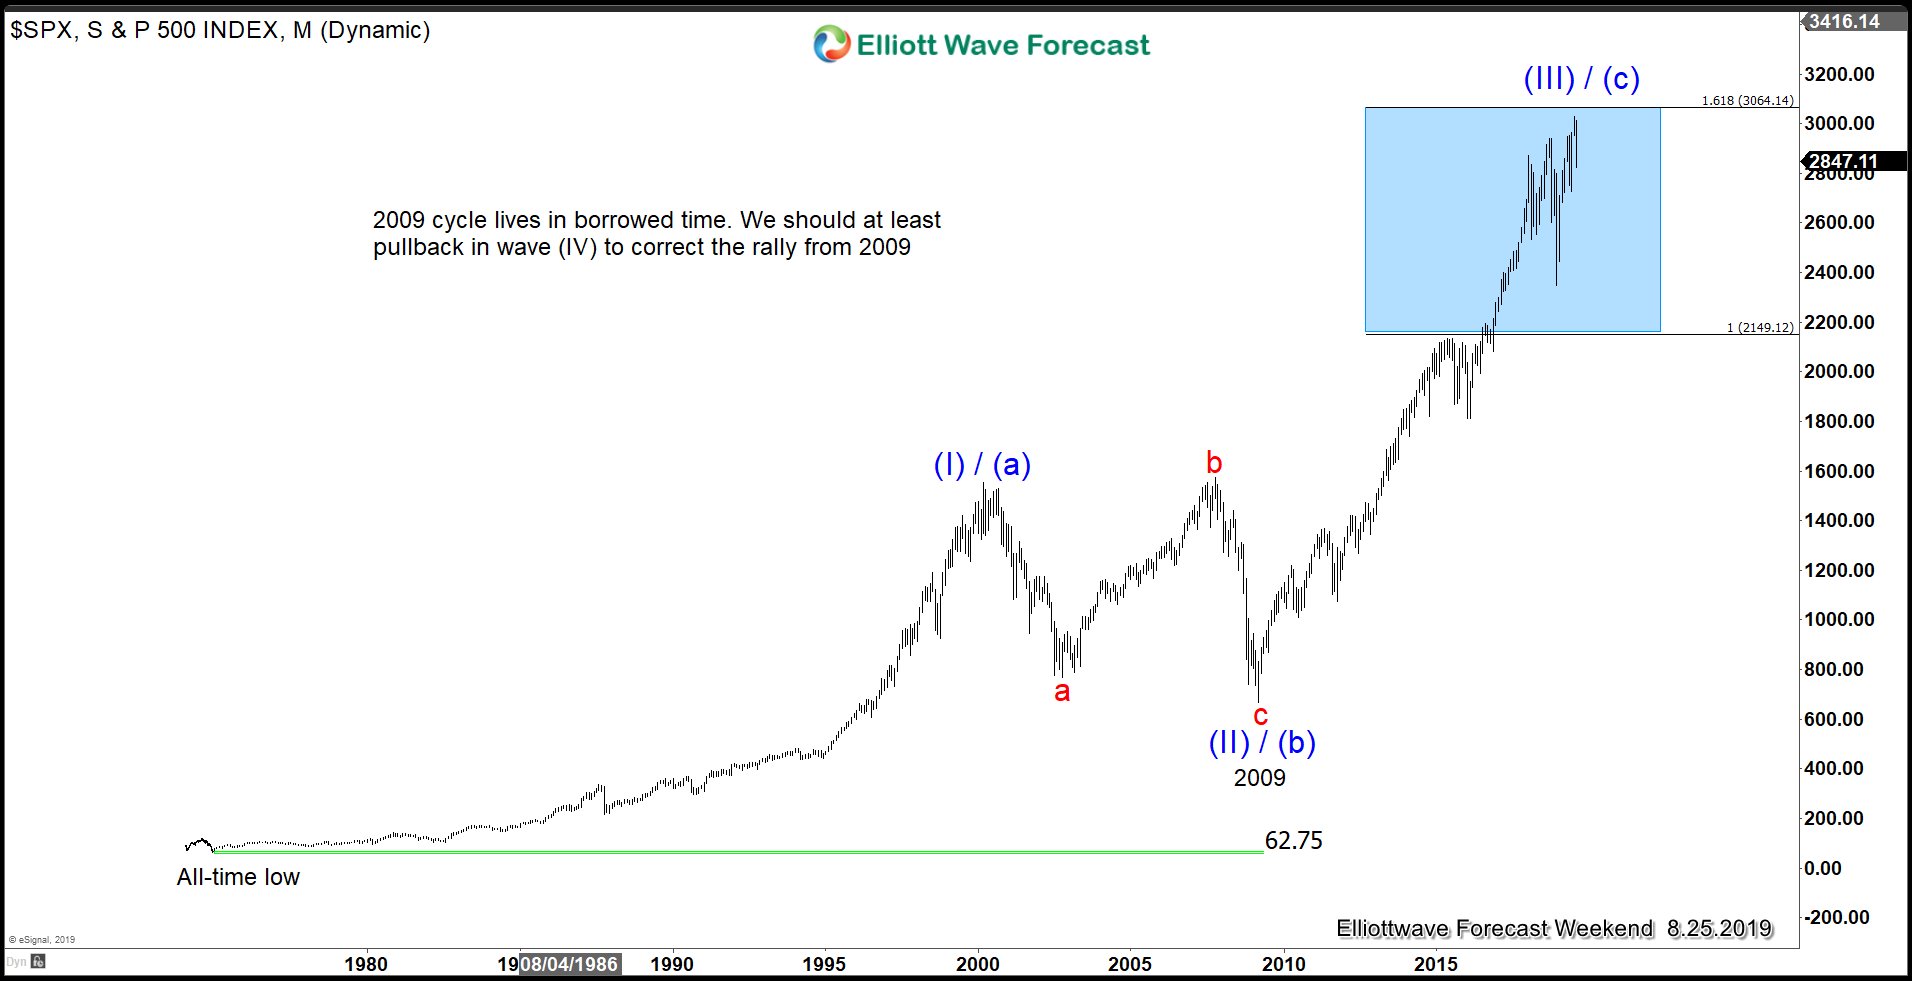
It remains to be our call that the cycle from 2009 low is mature and S&P 500 should soon pullback in wave (IV) in larger 3 waves at least. As we said in the previous article, a yield curve inversion in the past precedes a recession by about 2 years in time. Therefore, we still can not rule out one last rally in wave (V) later before the biggest pullback happens. The alternate view suggests the rally in S&P 500 is in a 3 waves (a)-(b)-(c) zigzag and in this case the biggest pullback is already due.
S&P 500 closed below 2018 trend line
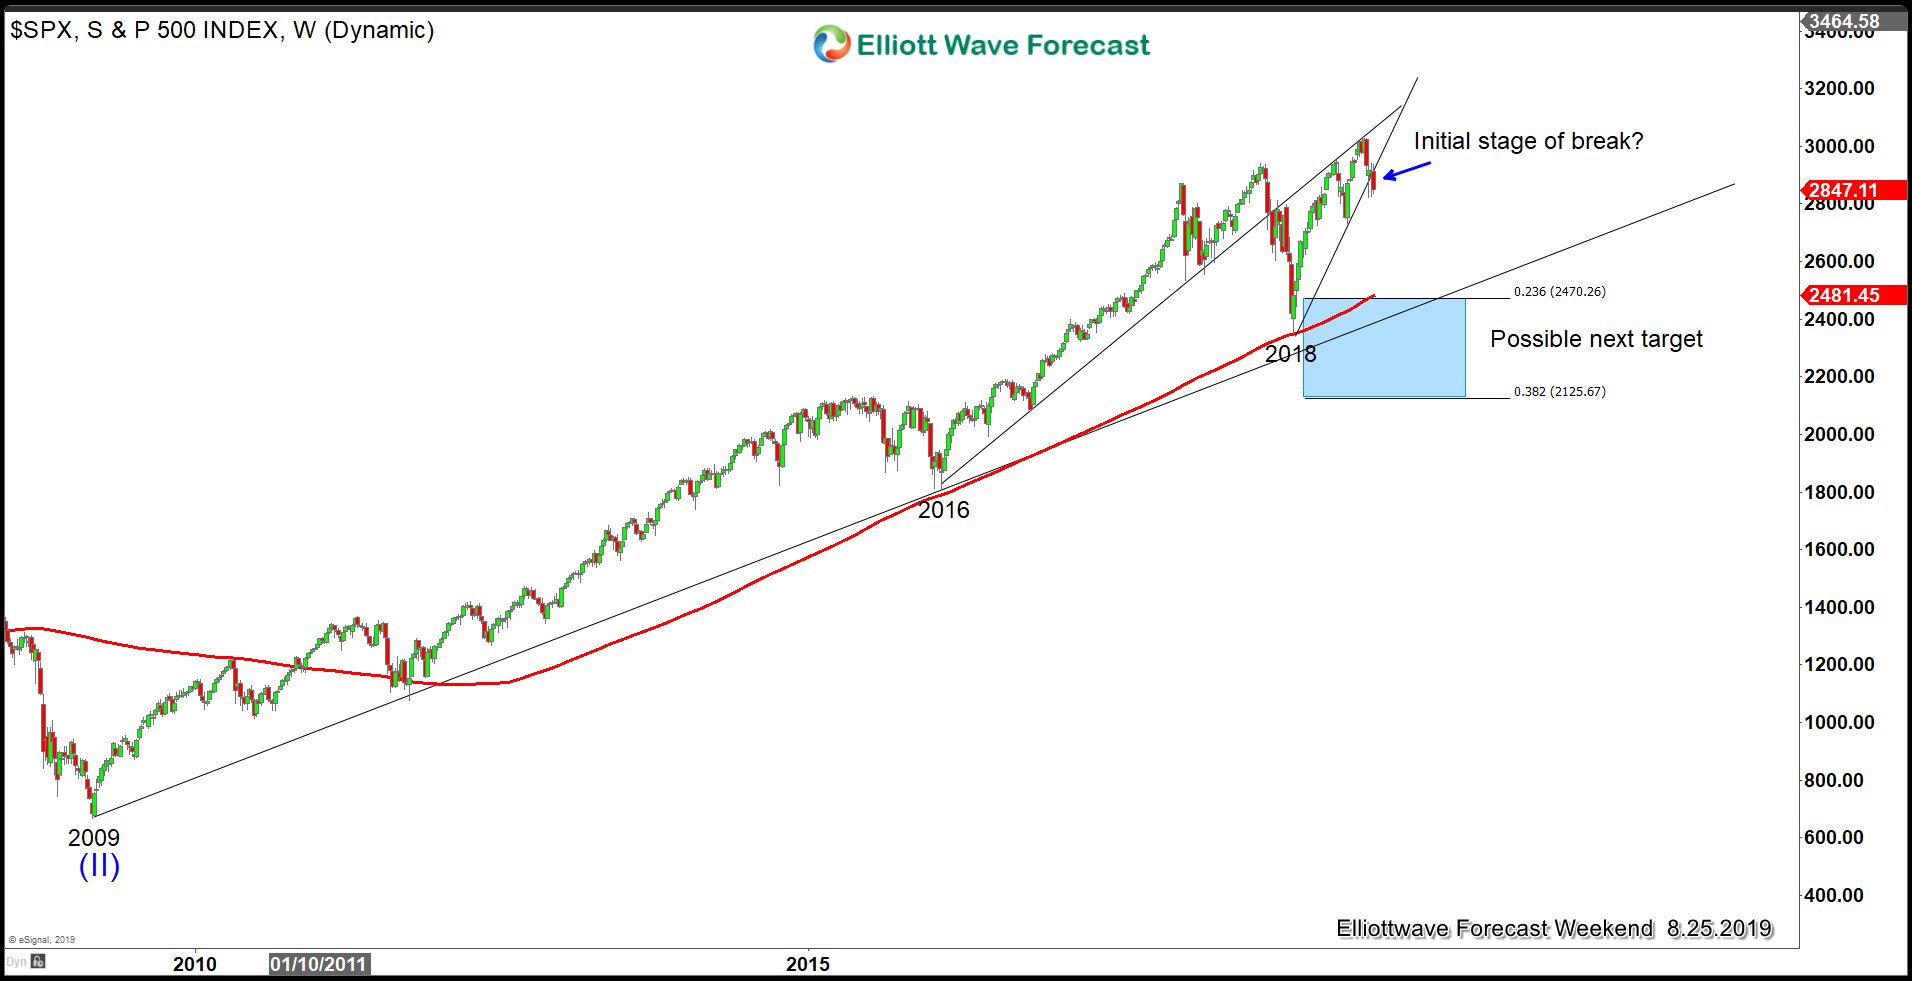
The bulls tried to hold above the 2018 ascending trend line last week but failed to do it. The Index has now decisively closed below the trend line. If the Index has started to do the wave (IV) pullback as the first chart suggests, then it can potentially go to 2125 – 2470 as the next potential strong support. This is the 23.6 – 38.2 Fibonacci retracement from wave (II) low in 2009 . It also has the support of the ascending trend line and 200 weekly moving average.
Short Term S&P 500 Outlook
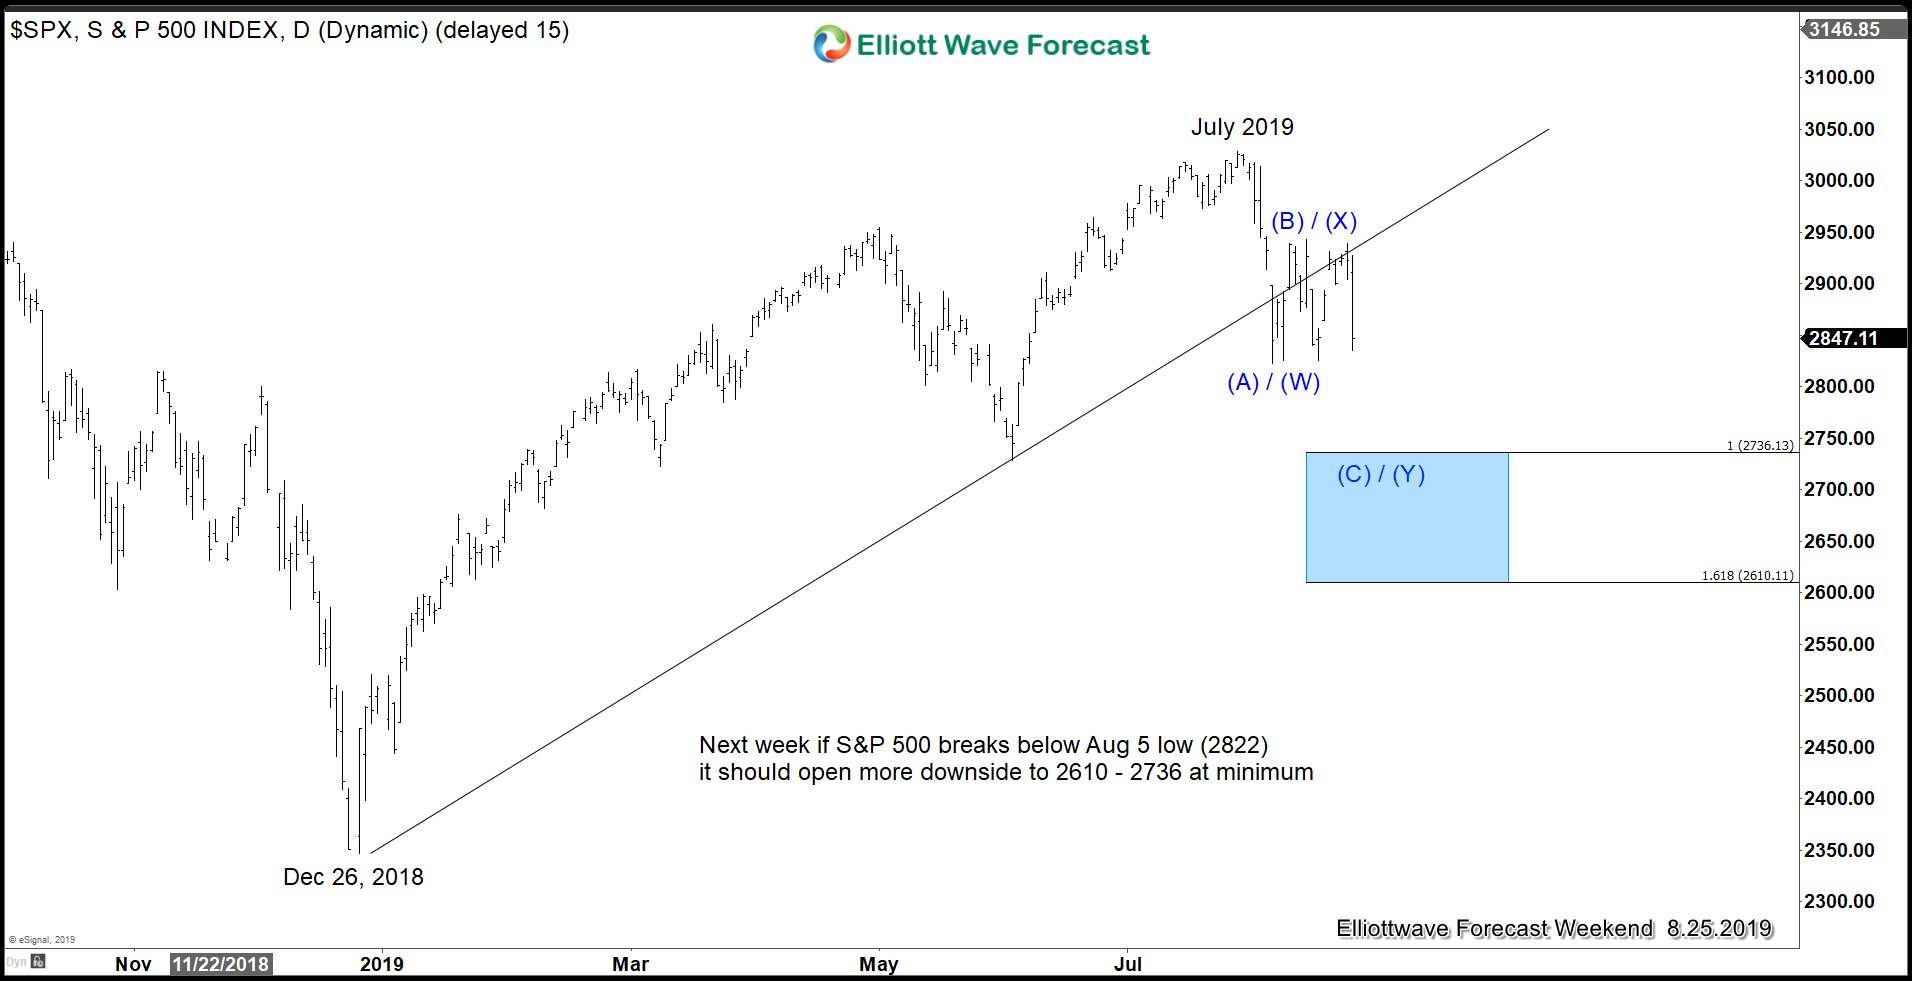
Short Term outlook in S&P 500 (SPX) suggests further downside is likely. The view will get further confirmation if the Index is able to break below August 5 low (2822) next week. Once August 5 low breaks, the next short term minimum target is 2610 – 2736. With weekly close below the trend line from 2018 high, the odd suggests for further downside in coming weeks.