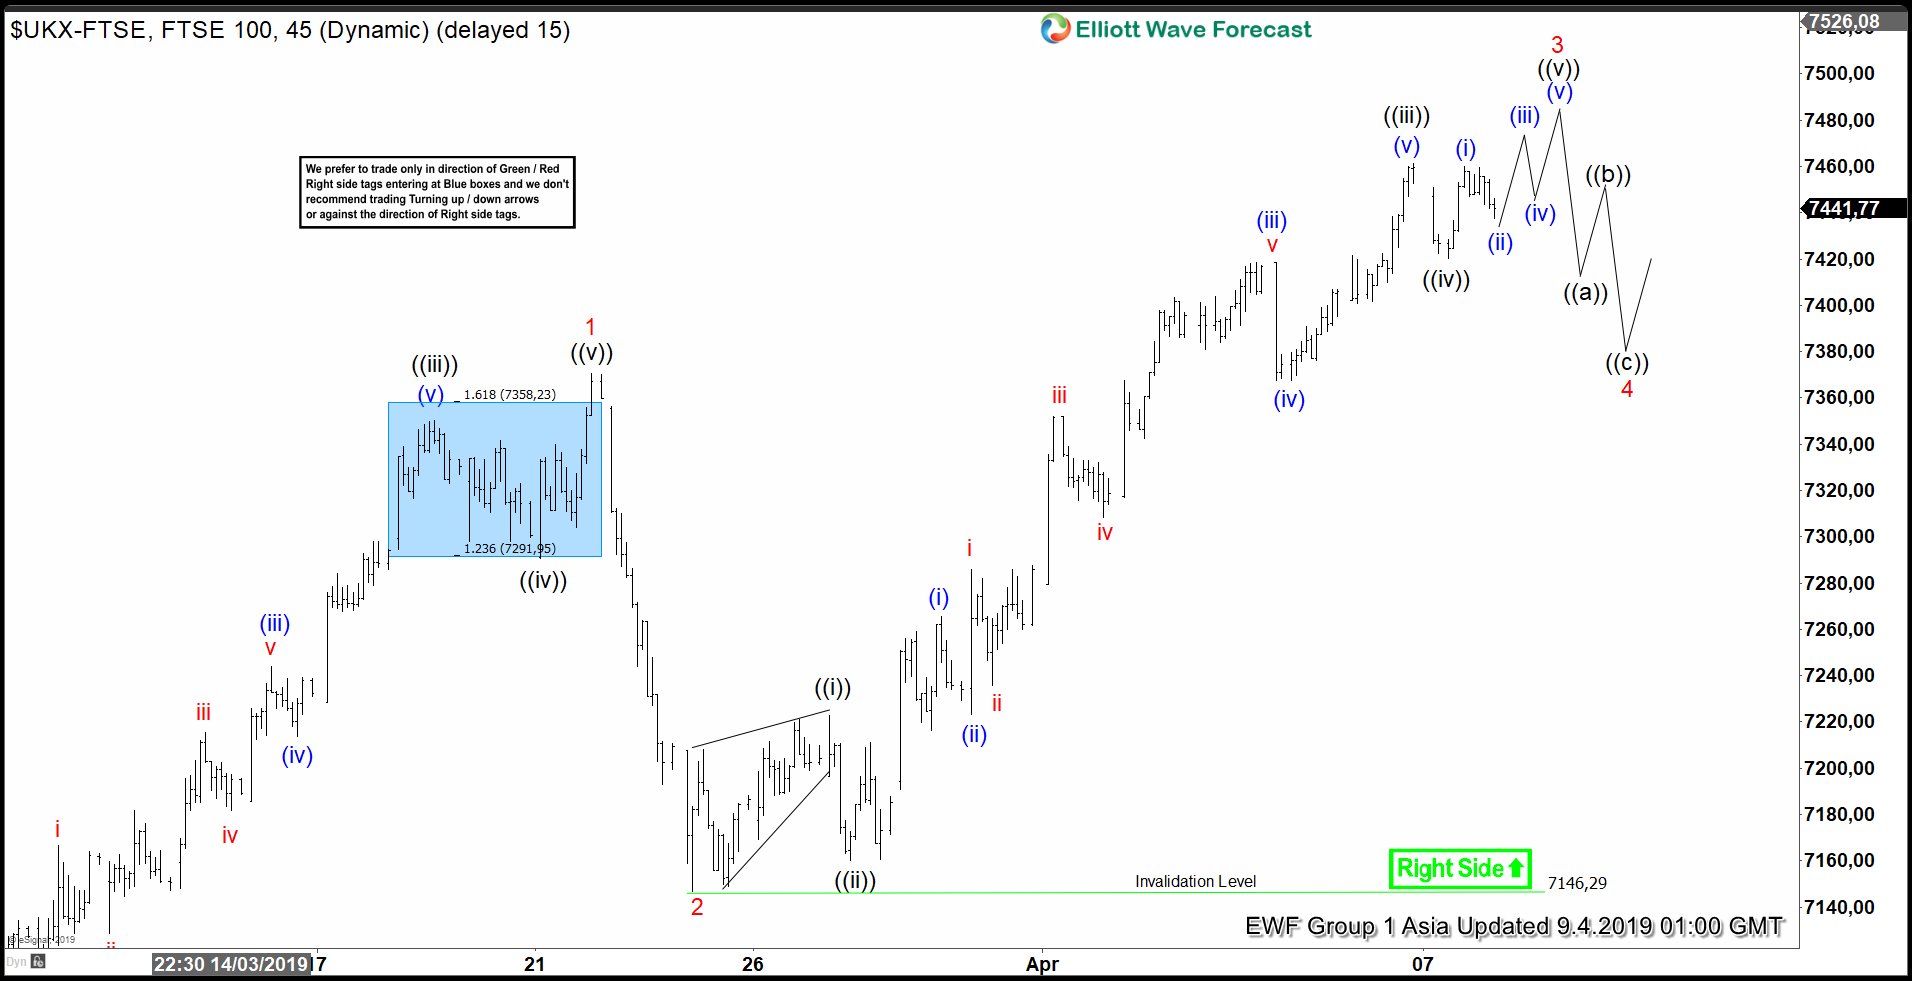
Elliott Wave view on FTSE calls the rally from February 28, 2019 low (7041) as an impulse Elliott Wave structure. An impulse is a 5 waves structure with wave 1, 3, and 5 all subdivide in 5 waves of lesser degree. Up from 7041 low, wave 1 ended at 7370.6 and wave 2 ended at 7146.29. Wave 3 remains in progress and subdivides as 5 waves of lesser degree. Up from 7146.29, wave ((i)) ended at 7222.64, wave ((ii)) pullback ended at 7160.14. Index resumes rally in wave ((iii)) at 7461.39, and wave ((iv)) ended at 7420.41. Short term, Index has scope to extend higher 1 more time in wave ((v)) before ending wave 3.
Afterwards, Index should pullback in wave 4 before the rally resumes in wave 5. Wave 4 should correct wave 3 rally from 7146.29 low and expected to complete at 23.6-38.2 Fibonacci retracement. Once wave 3 is complete, we can then project wave 4 potential area. We don’t like selling the Index and expect buyers to appear to buy dips in 3, 7, or 11 swing as far as pivot at 7146.29 low stays intact.
1 Hour FTSE Elliott Wave Chart Asia Update