I want to share with you Elliott Wave charts of Sugar which we presented to our members recently. You see the 1-hour updated chart presented to our clients on the 03/18/19. The higher degree trend of the pair is to the downside. So our members know that the right side is to the downside in the daily chart. Consequently, we advised members that we don’t like buying Sugar. And if you know what not to trade in the markets you have already won half of the battle because you know which direction is not the right one.
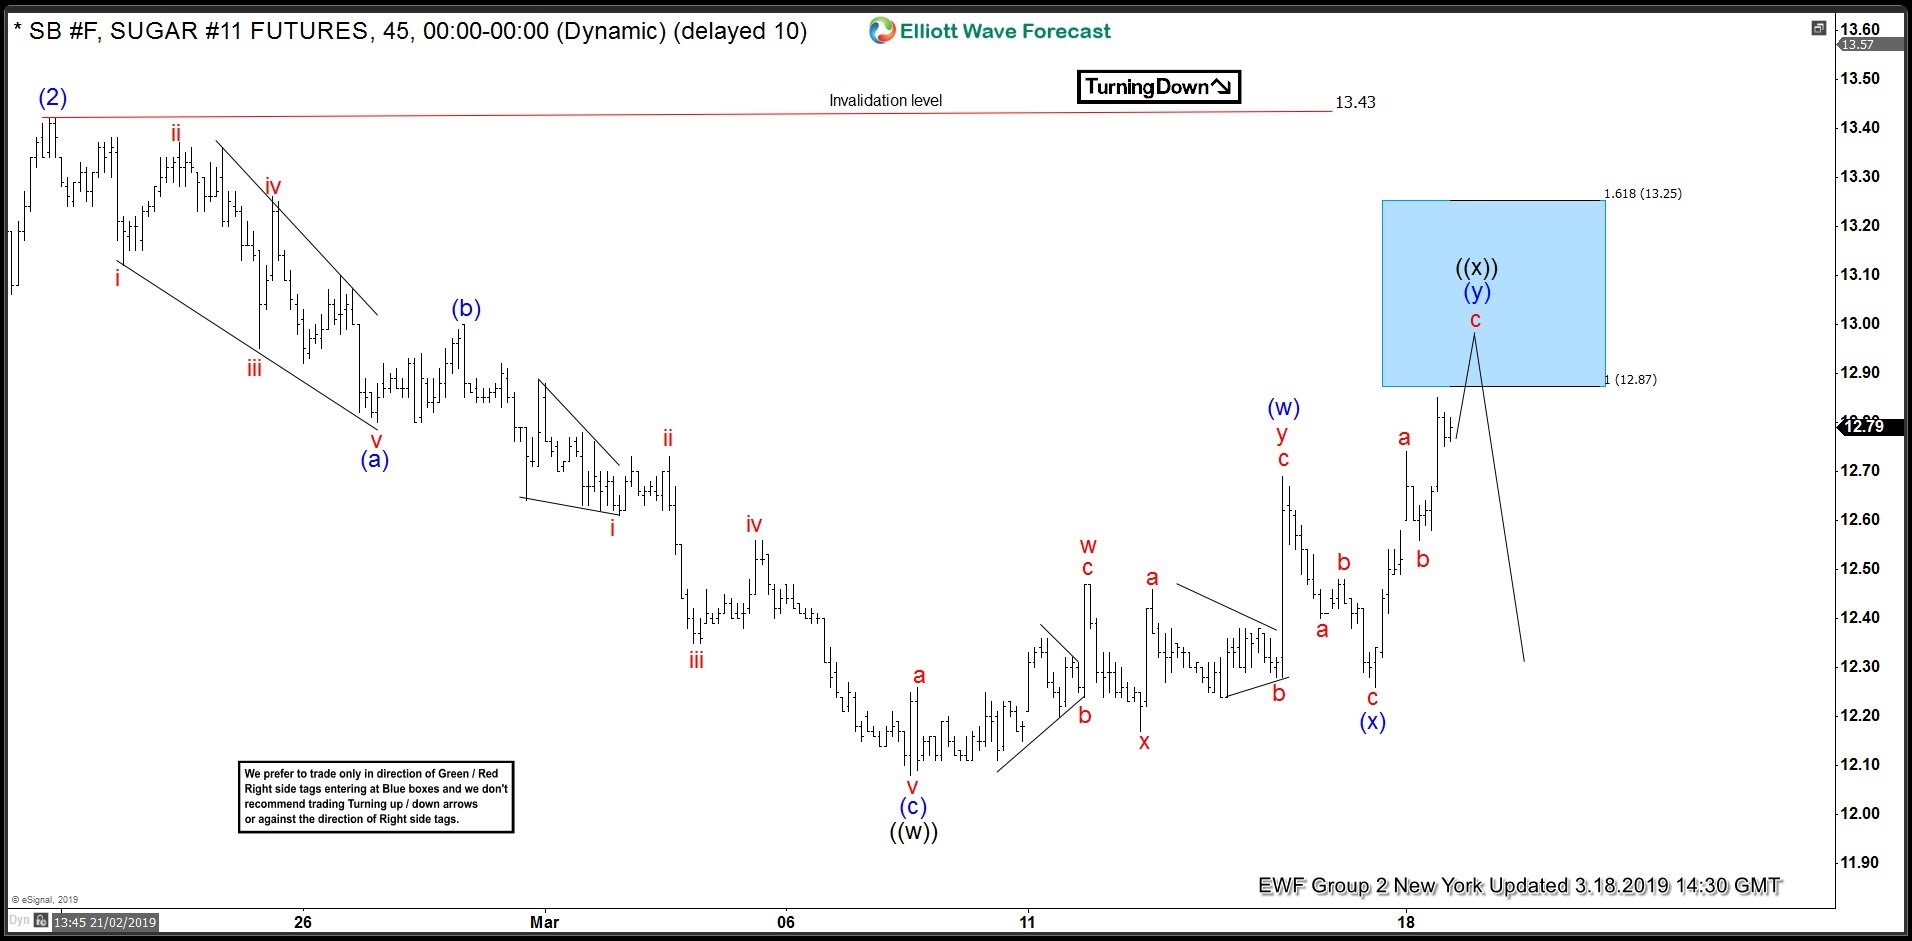
Sugar ended the cycle from 02/20/19 peak in black wave ((w)) at 03/07/19 low (12.15). Above from there, we expected a bounce to occur in black wave ((x)). The bounce unfolded in an Elliott Wave double correction structure. We advised members that Sugar should continue lower. Therefore, we expected sellers to appear in the sequences of 3, 7 or 11 swings. At the 100 – 1.618 Fibonacci extension of blue (w)-(x) which came at around 12.87-13.25 area and that was the first area for the selling to take place.
Sugar 03.18.2019 1 Hour Chart Elliott Wave Analysis
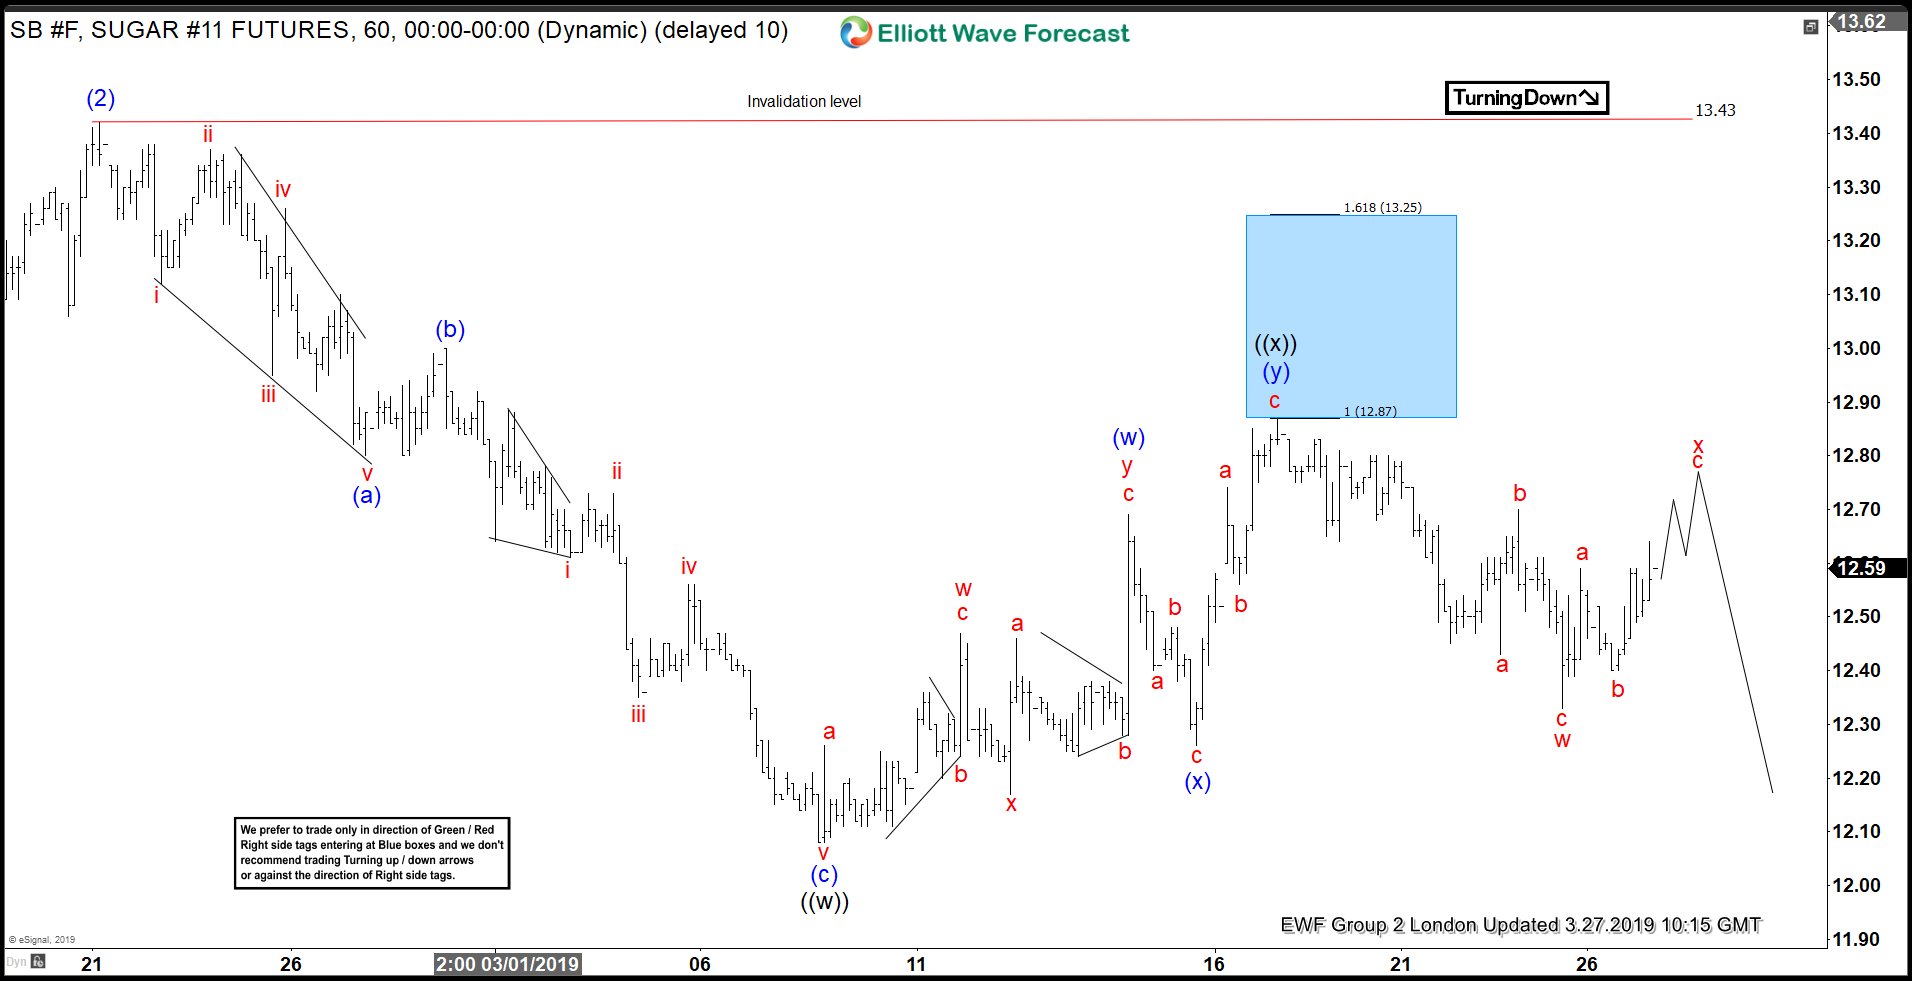
In the last Elliott Wave chart. You can see that Sugar reached the blue box area perfectly. It did not extend into the blue box and reacted immediately lower. We need to keep in mind that in other scenarios the market can also extend into the blue box before a reaction lower/higher can be seen. If traded the blue box. Then any trades from that area shown in the chart above were risk-free, which means the stop-loss should be moved to break even, looking now for another extension lower. Please keep in mind that the 1-hour chart which I presented can have changed. This blog should just illustrate how accurate our blue boxes are, and how our members trade our 3-7 or 11 swings strategy.
If you are interested in how to trade our blue box areas and want to understand how Elliott Wave works. We present a lot of trading setups in our 3 Live Trading Rooms.
Sugar 03.27.2019 1 Hour Chart Elliott Wave Analysis
I hope you liked this blog and I wish you all good trades.
We provide precise forecasts with up-to-date analysis for 78 instruments including Forex, Commodities, ZN (10 year note yields), World Indices, Stocks, ETFs and Bitcoin. Our clients also have immediate access to Market Overview, Sequences Report, 1 Hour, 4 Hour, Daily & Weekly Wave Counts. Daily & Weekend Technical Videos, Live Screen Sharing Sessions, Live Trading Rooms and Chat room where they are provided live updates and given answers to their questions. The guidance of ElliottWave-Forecast gives subscribers the wherewithal to position themselves for proper entry and exit in the markets. We believe our disciplined methodology and Right side system is pivotal for long-term success in trading.