Nasdaq (NQ_F) is showing a preliminary sign that the cycle from December 26, 2018 low has ended. After forming the high at 7544.68 on March 22, 2019, the Index has started to turn lower. The first leg of the decline looks impulsive and ended wave (A) at 7290. Then after a bounce in wave (B) to 7447.50, the Index has turned lower and broken below wave (A) again, suggesting further extension lower is likely. If the Index really ended cycle from Dec 26, 2018 low, this means at minimum it should do a larger pullback in 3, 7, or 11 swing to correct that cycle.
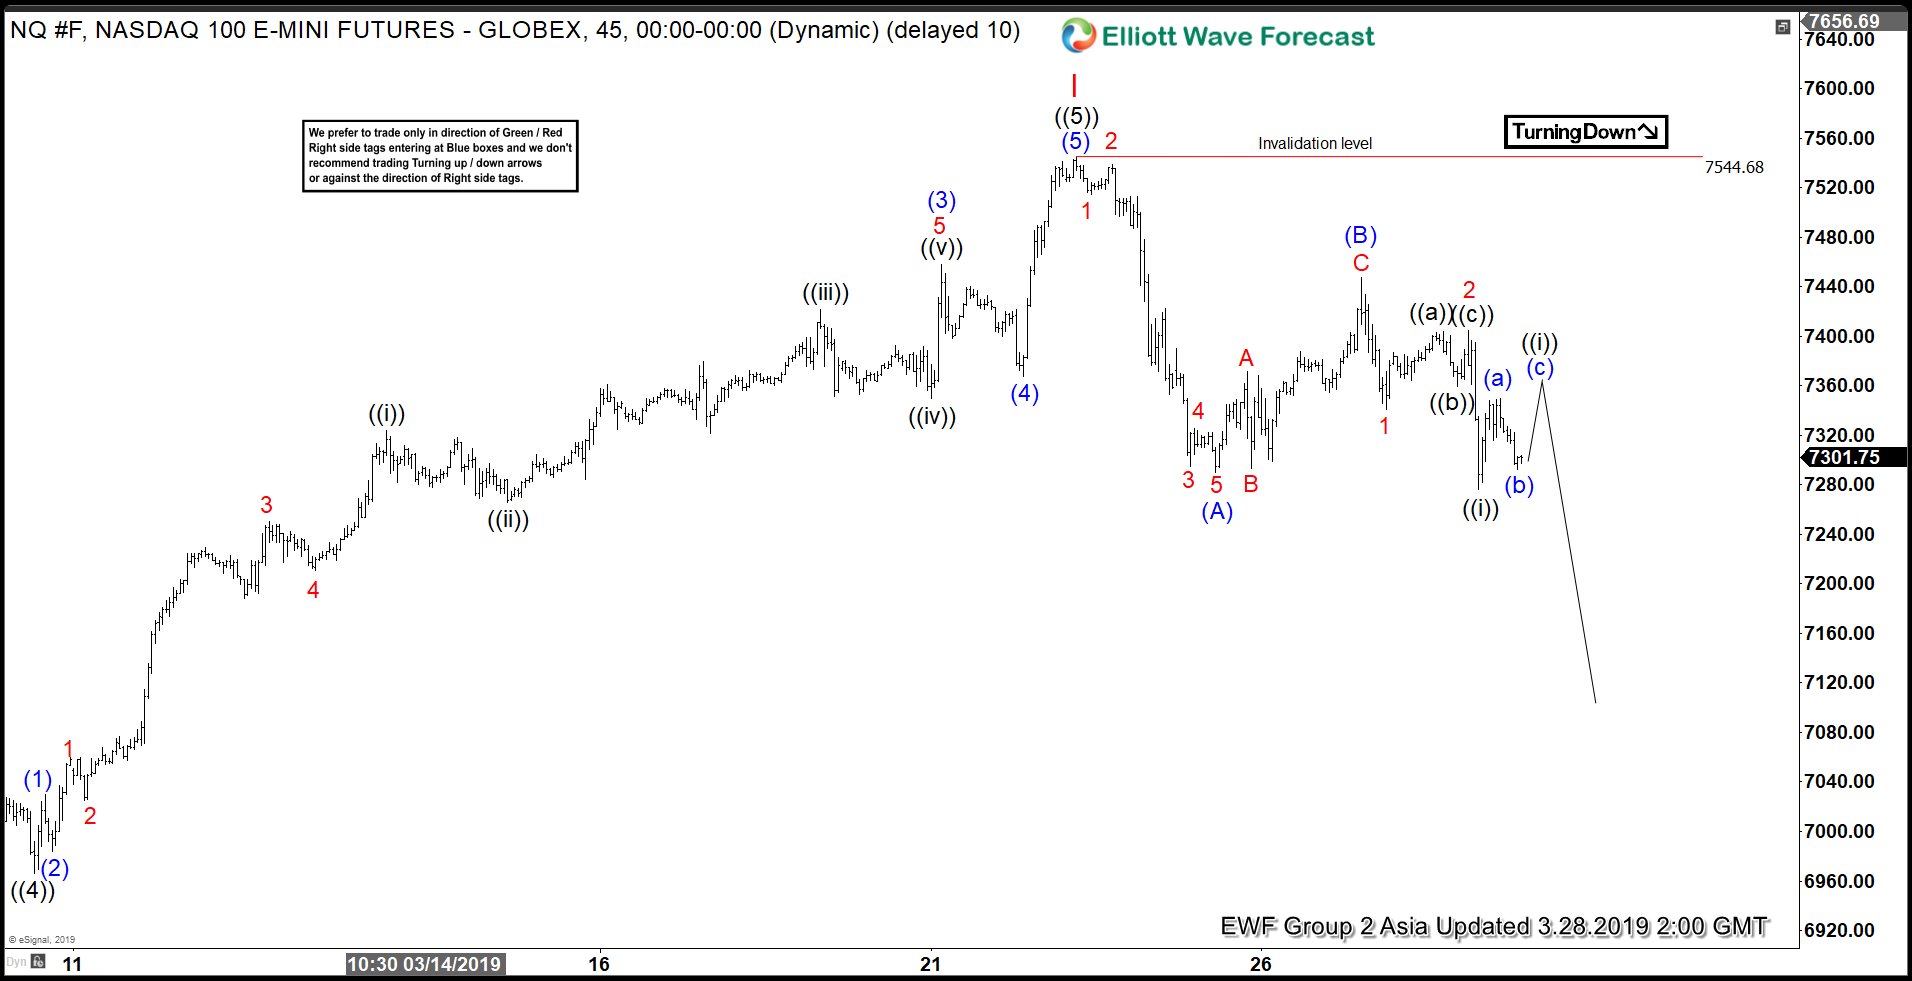
The entire rally from Dec 26, 2018 low ended at 7544.68. Down from there, the first leg of the decline ended wave (A) at 7290. Internal of wave (A) is unfolding as an Impulse Elliott Wave structure. Wave 1 of (A) ended at 7514.5 and wave 2 of (A) ended at 7538.50. Wave 3 of (A) shows an extension and ended at 7294.75, wave 4 of (A) ended at 7325.50, and wave 5 of (A) ended at 7290. Index then bounced within wave (B) as a zigzag Elliott Wave structure. Wave A of (B) ended at 7371.50, wave B of (B) ended at 7293.50, and wave C of (B) ended at 7447.50. Wave (C) lower looks to have started as the Index already broke below wave (A) at 7290.
We are counting the wave (C) as an impulse with a nest. As far as the bounce stays below 7544.68, expect the Index to extend lower.
1 Hour Nasdaq (NQ_F) Elliott Wave Chart