
After repeated rebuke by President Trump, the Fed has completely capitulated. Following the two-day meeting, the Fed has scaled back their projected interest rates rise to zero this year. This reflects the concern about slowing economic growth, global market uncertainty, financial market volatility, and muted inflation.
Powell: Brexit and US-China trade talks pose some risks to outlook from CNBC.
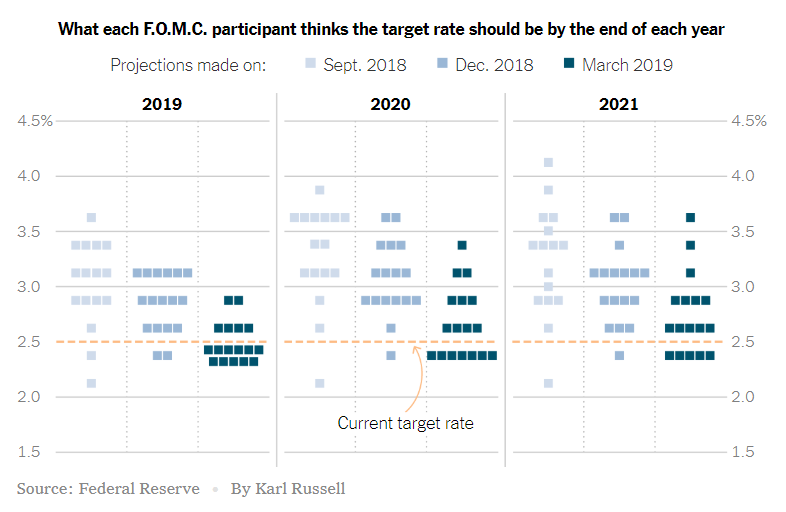
Contrast the Fed’s statement to three months ago when the Fed signaled several rate hikes this year. In addition, the Fed will slow down the rate of balance sheet normalization in May and end the drawdown in September. This is also a remarkable U-turn from the guidance last December. Last year, it suggested an autopilot approach with no change in pace of the balance sheet reduction.
Going into the meeting, the market generally expect the Fed to at least hike one more time this year and maintain the balance sheet reduction until the end of the year. From this perspective, the Fed has exceeded even the most dovish market expectation. The Fed now expects a 2.1% growth this year, down from 2.3% forecast last December. The outlook for 2020 is even more bleak with only 1.9% growth.
The Dot Plot comparison below shows the abrupt swing in the projection of interest rates in the coming years.
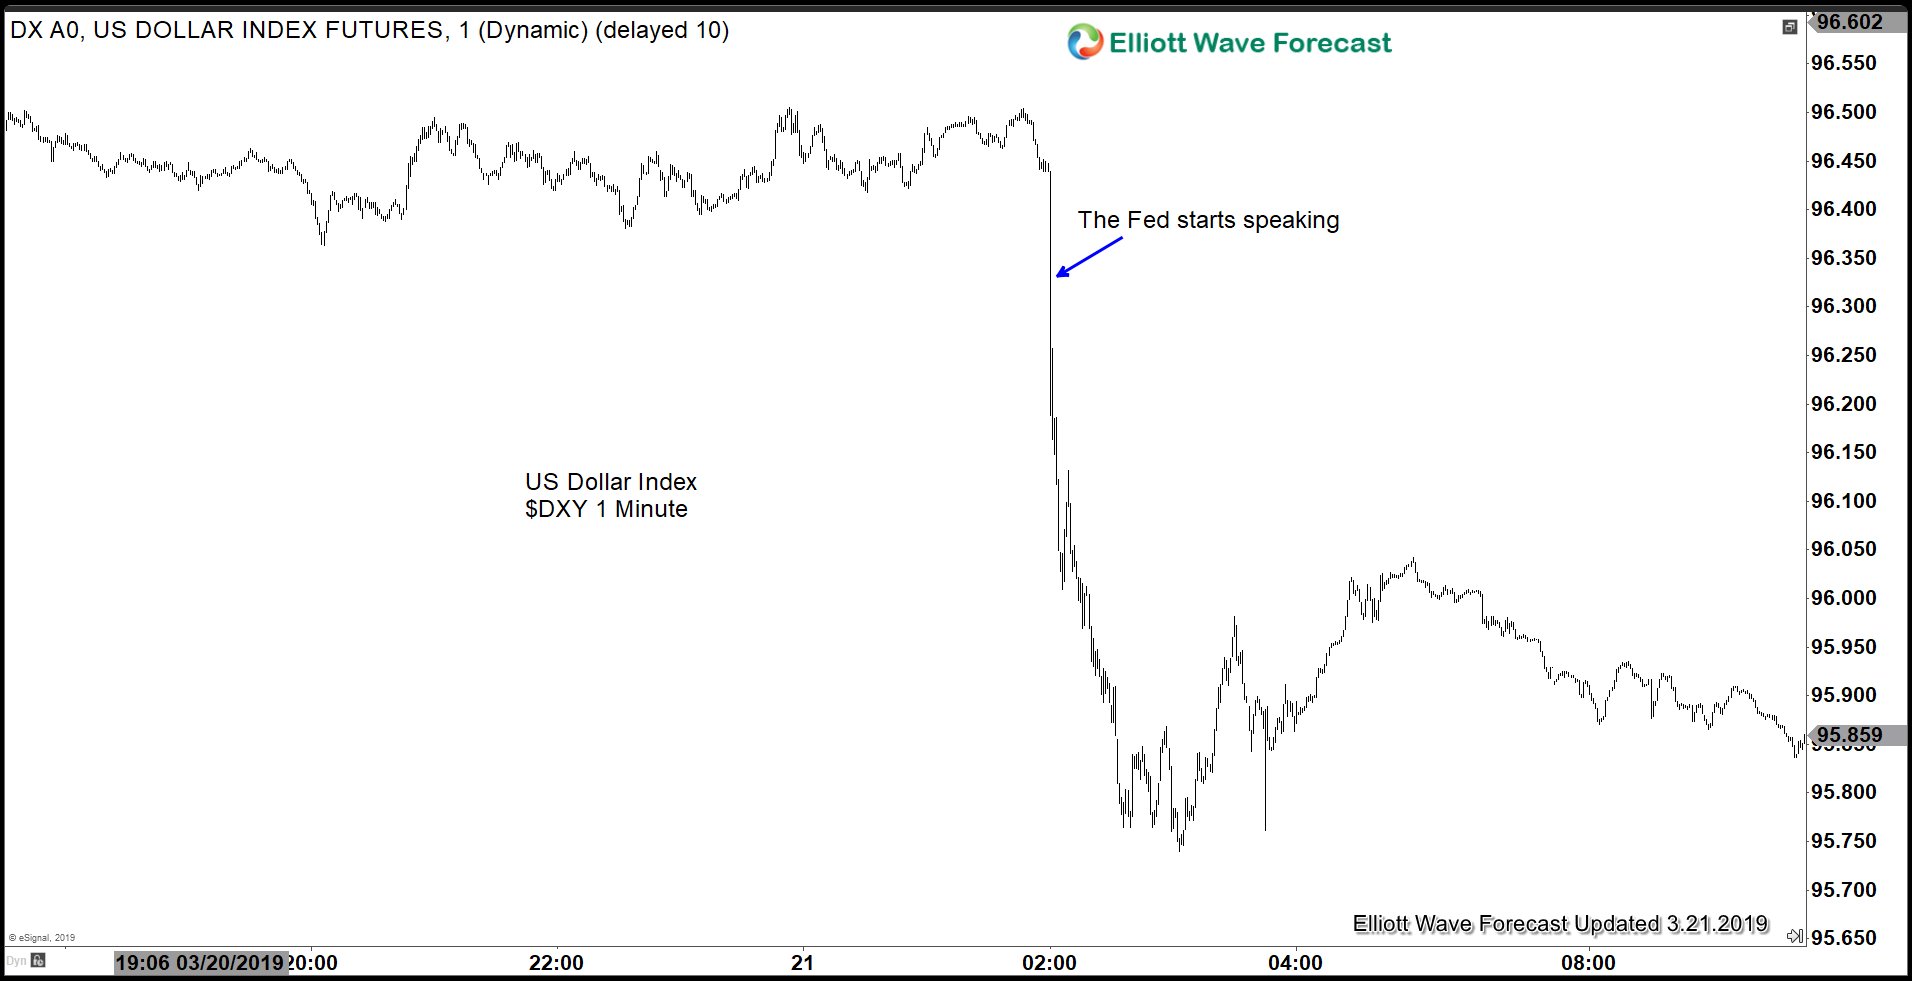
The minute the statement comes out, the US Dollar sold off aggressively.
USD Index 1 minute Chart
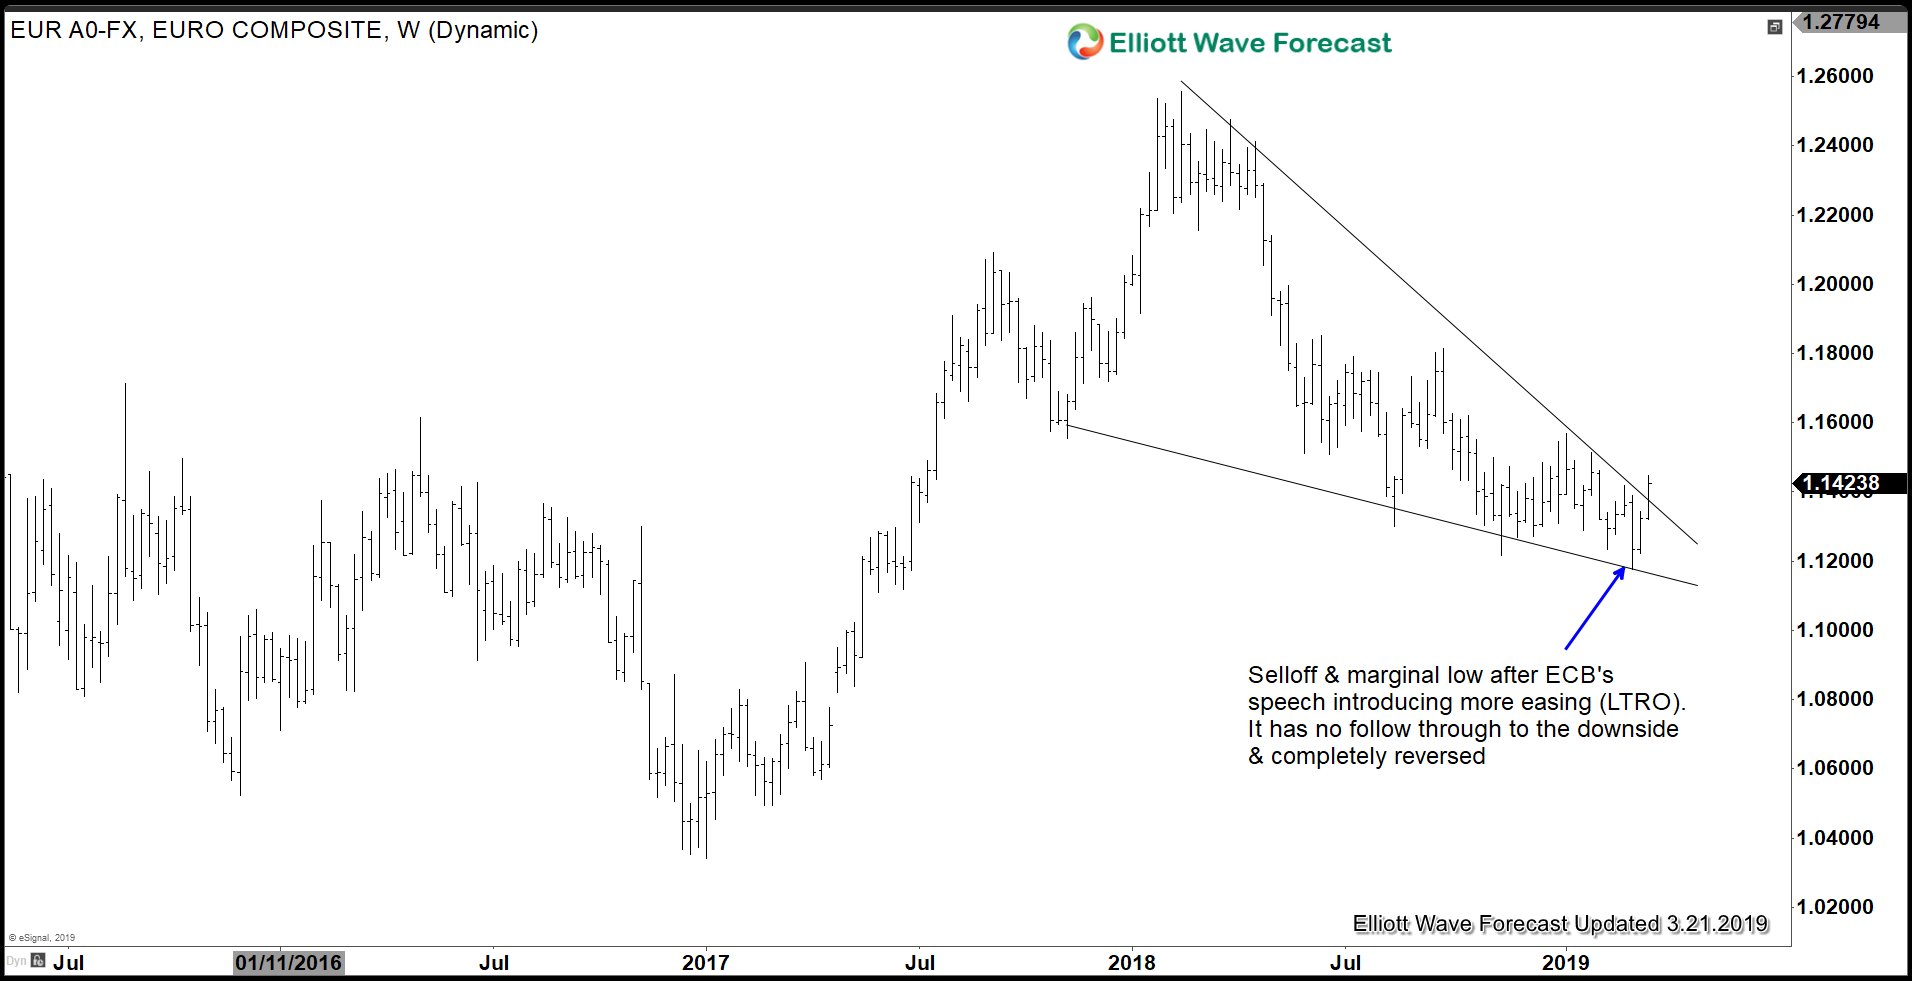
Similarly, the EURUSD also failed to have a follow through to the downside after ECB’s dovish message two weeks ago. Recall two weeks ago ECB’s President Mario Draghi introduced new easing measures called LTRO (Long Term Refinancing Operation). In fact, EURUSD has completely reversed all the losses as the chart below shows:
EURUSD Weekly Chart
In fact, looking at the charts of multiple USD pairs, we believe that US Dollar should continue to see further weakness. One of the clearest structures can be seen in $USDINR (Indian Rupee). Below is the daily chart showing incomplete sequence from October 2018 high, favoring more downside.
USDINR Daily Elliott Wave Chart
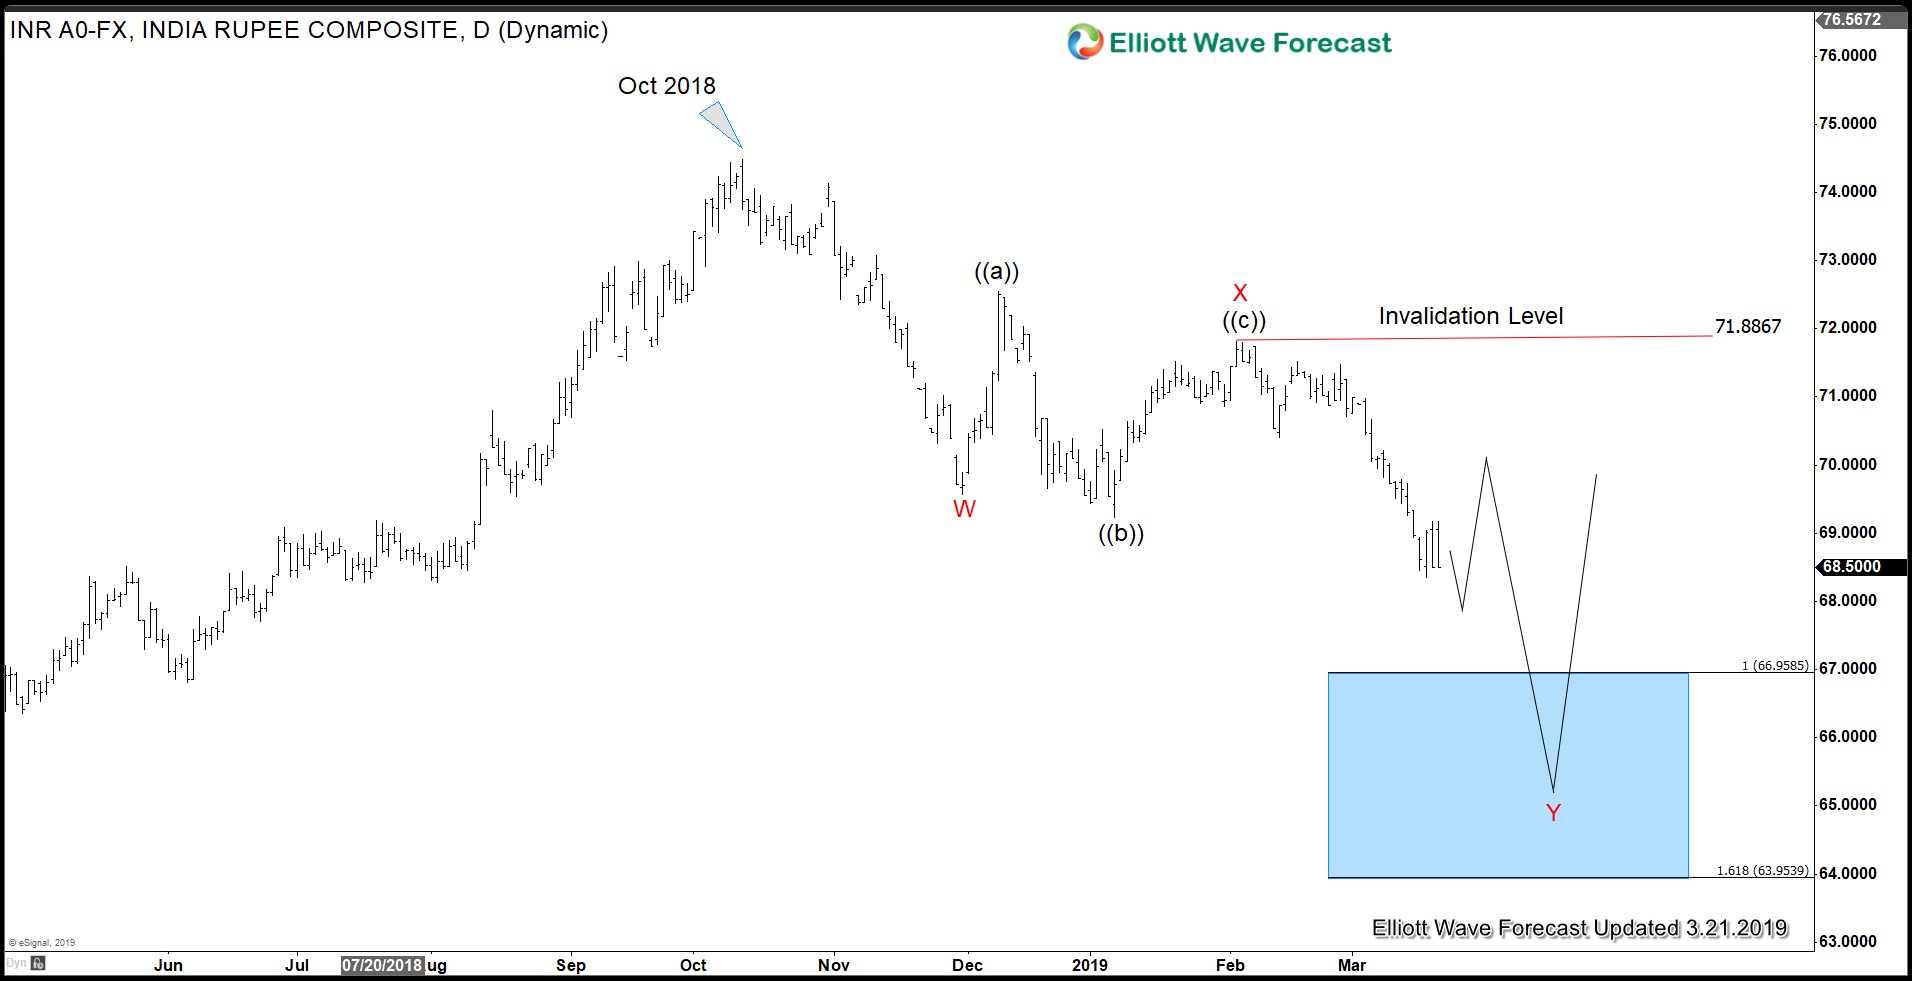
From the chart above, $USDINR should continue to see more downside while rally fails below wave X high at 71.8. The minimum target is 67 approximately when wave Y is equal in length to wave W. With the complete reversal of the Fed’s guidance and without further rate hike, US Dollar can continue to see further weakness in coming days / weeks.