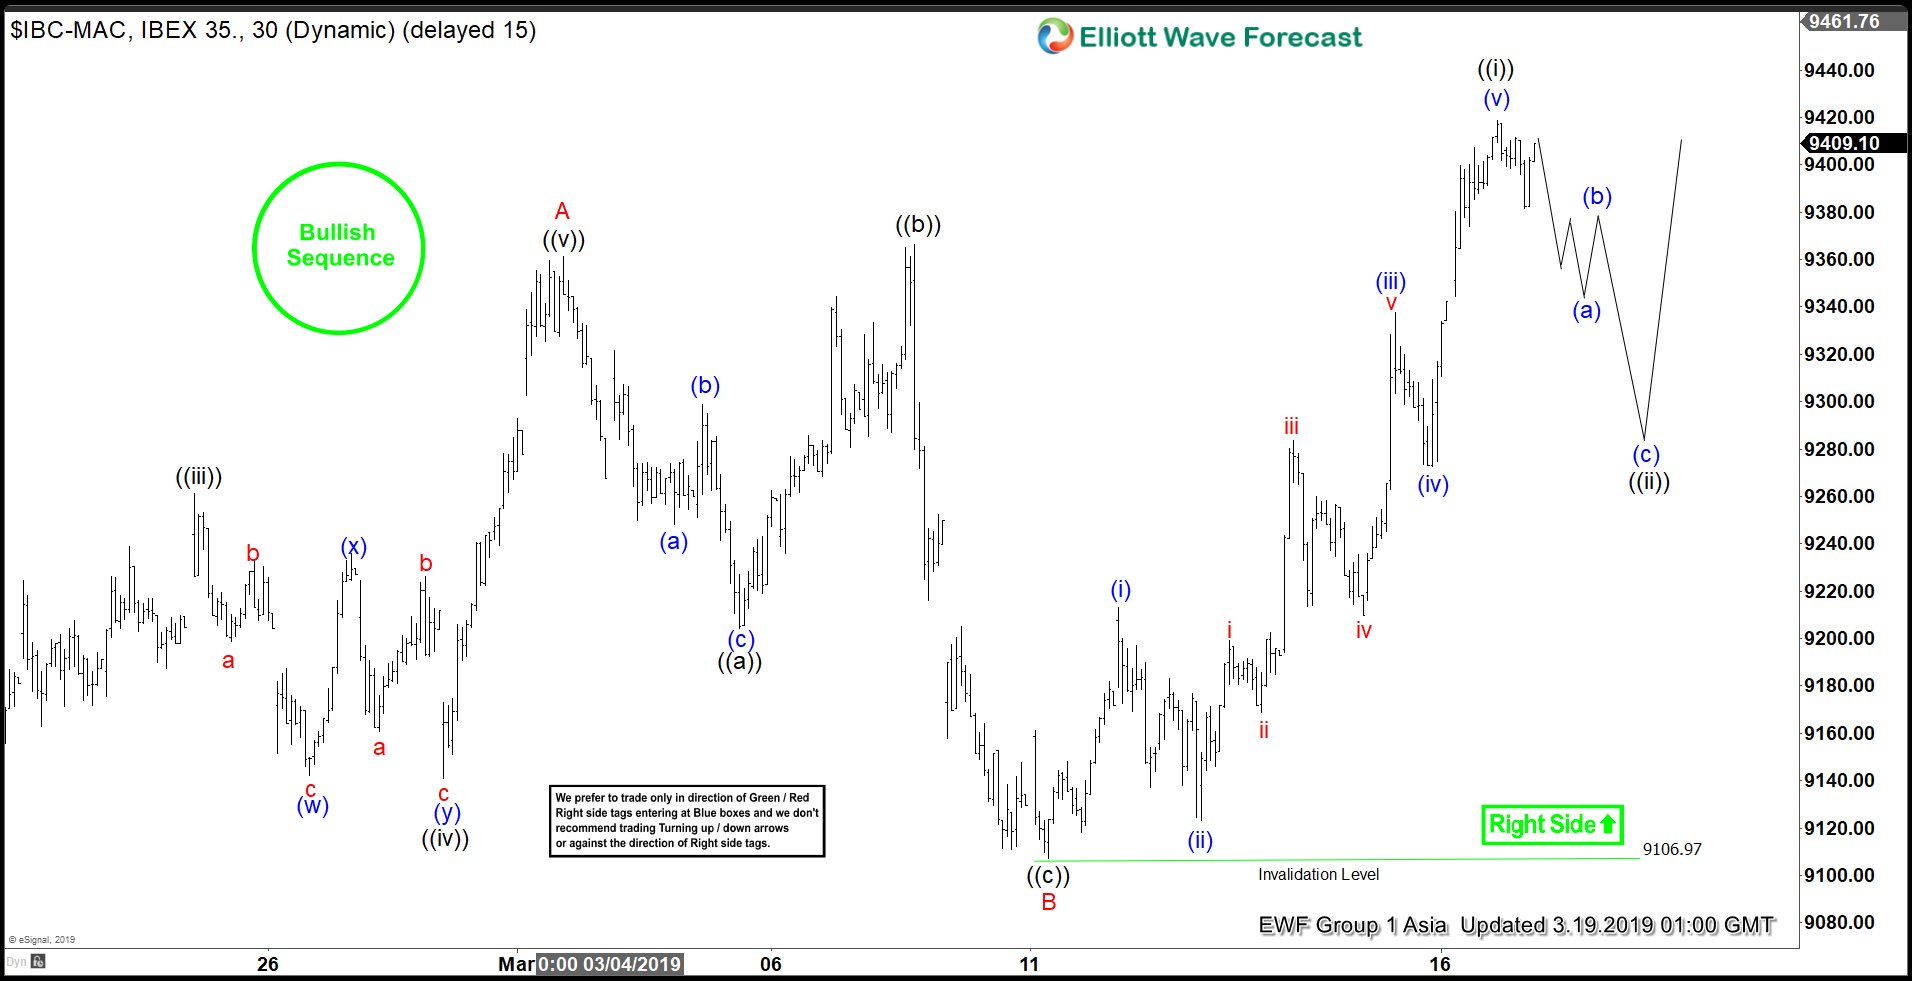
IBEX Elliott Wave sequence from 12.28.2018 low remains bullish, favoring further upside. Near term, the rally from Feb 11, 2019 low (8834.3) is unfolding as a zigzag Elliott Wave structure. The first leg of this zigzag wave A ended at 9361.4 as a 5 waves impulse structure. Wave B pullback ended at 9106.97 as a Flat Elliott Wave structure. Down from 9361.4, wave ((a)) ended at 9204.4, wave ((b)) ended at 9366.2, and wave ((c)) of B ended at 9106.97.
The index has resumed wave C rally higher and broken above previous peak on 9366.2. The internal of wave C is also unfolding as a 5 waves impulse where wave ((i)) is proposed complete at 9418.8. If Index breaks above 9418.8, that suggests wave ((i)) remains in progress but doesn’t change the overall outlook. Near term, while wave ((ii)) pullback stays above 9106.97, expect Index to extend higher. We don’t like selling the Index and expect buyers to appear in 3, 7, or 11 swing as far as pivot at 9106.97 stays intact. Potential target to the upside comes at 9652 – 9771 area where wave C is equal to wave A in length.
1 Hour IBEX Elliott Wave Chart