Hello fellow traders. In this technical blog we’re going to take a quick look at the Elliott Wave charts of NASDAQ. As our members know recently we got pull back that was unfolding as Elliott Wave Double Three Pattern. We expected NASDAQ to find buyers again and trade higher due to incomplete bullish seqeuences in the December 26th 2018 low. In the following article, we’re going to explain the Elliott wave structure and Forecast.
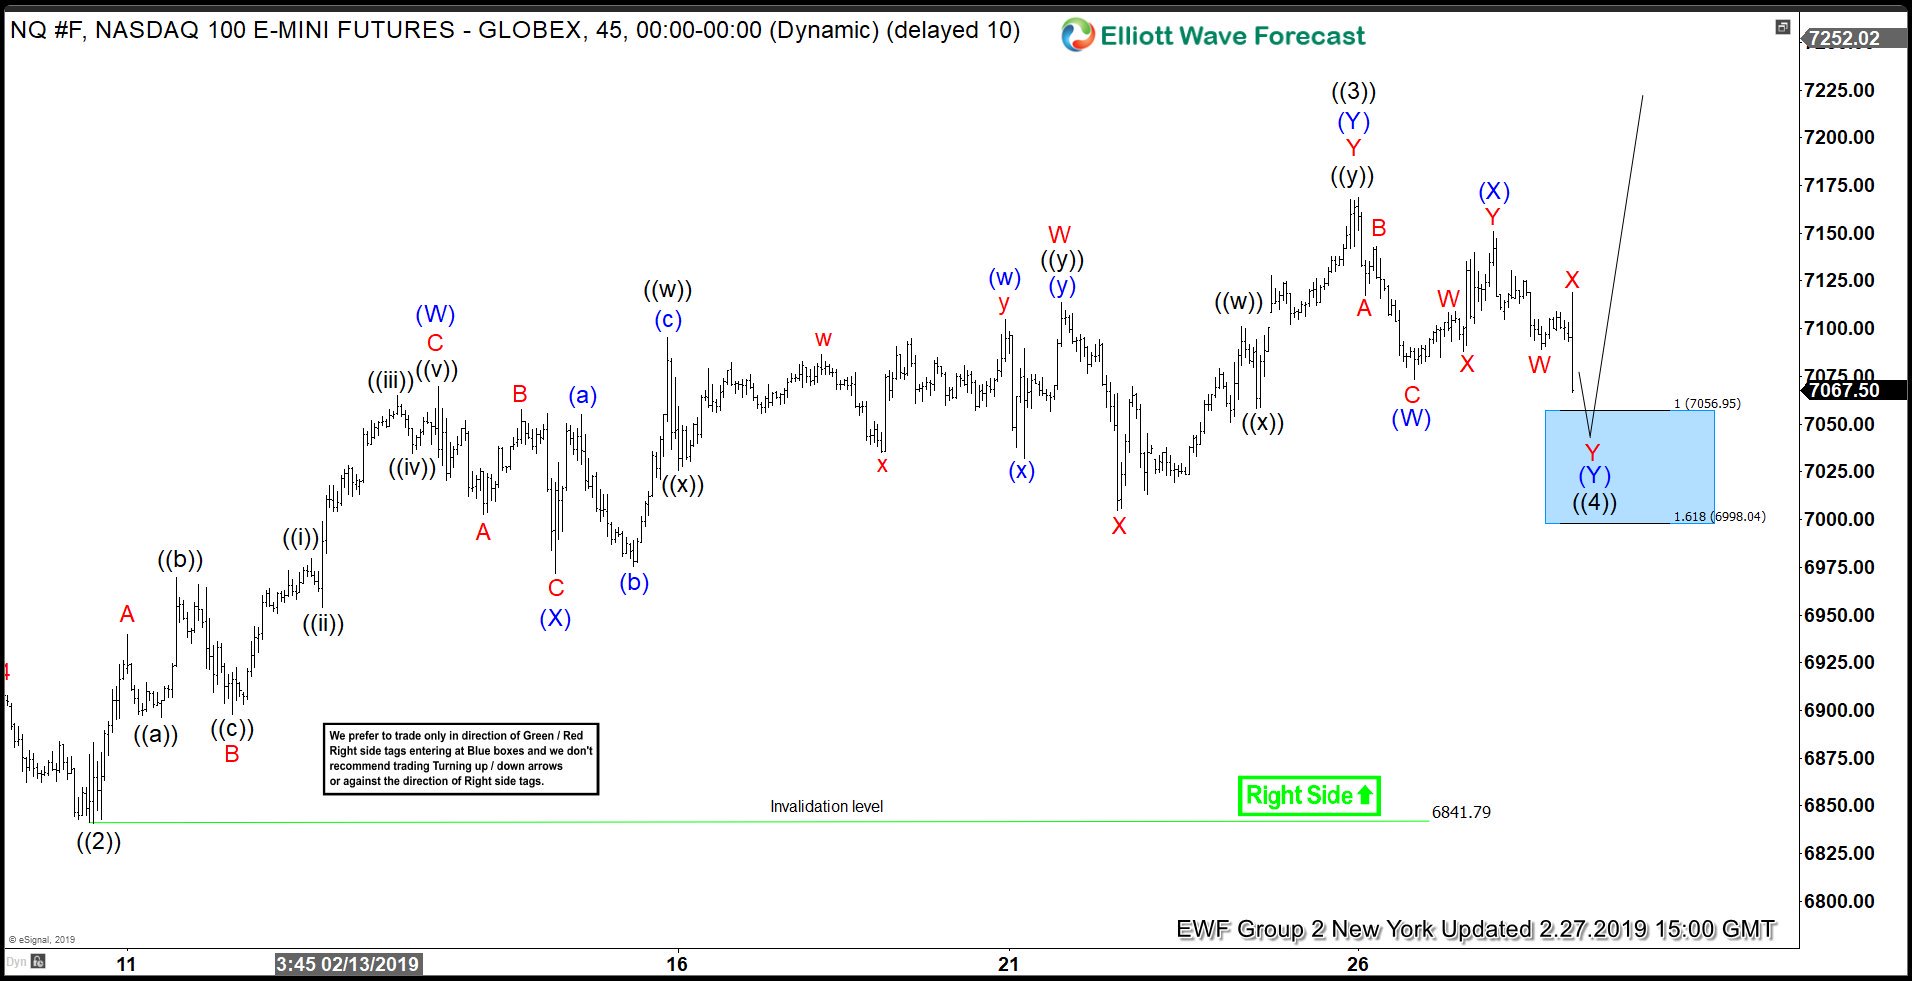
NASDAQ 1 Hour Elliott Wave Analysis 2.27.2019
As we can see on the chart below , NASDAQ ended cycle from the 6841.79 low and now correcting it. Pull back is unfolding as Double Three – 7 swings structure, labeled as (W)(X)(Y) blue. As of right now pull back looks incomplete , missing equal legs from the peak. We’re calling for more short term weakness in (Y) leg toward the blue box area : 7065.95-6998.04. As our members know, Blue Boxes are no enemy areas , giving us 85% chance to get a bounce. As NASDAQ is trading with the incomplete December’s cycle , we expected buyers to appear there at the Blue Box for further rally or wave bounce alternatively. Consequently , we don’t recommend selling NASDAQ and favor the long side, buying the dips in the Blue Box area : 7056.95-6998.04.
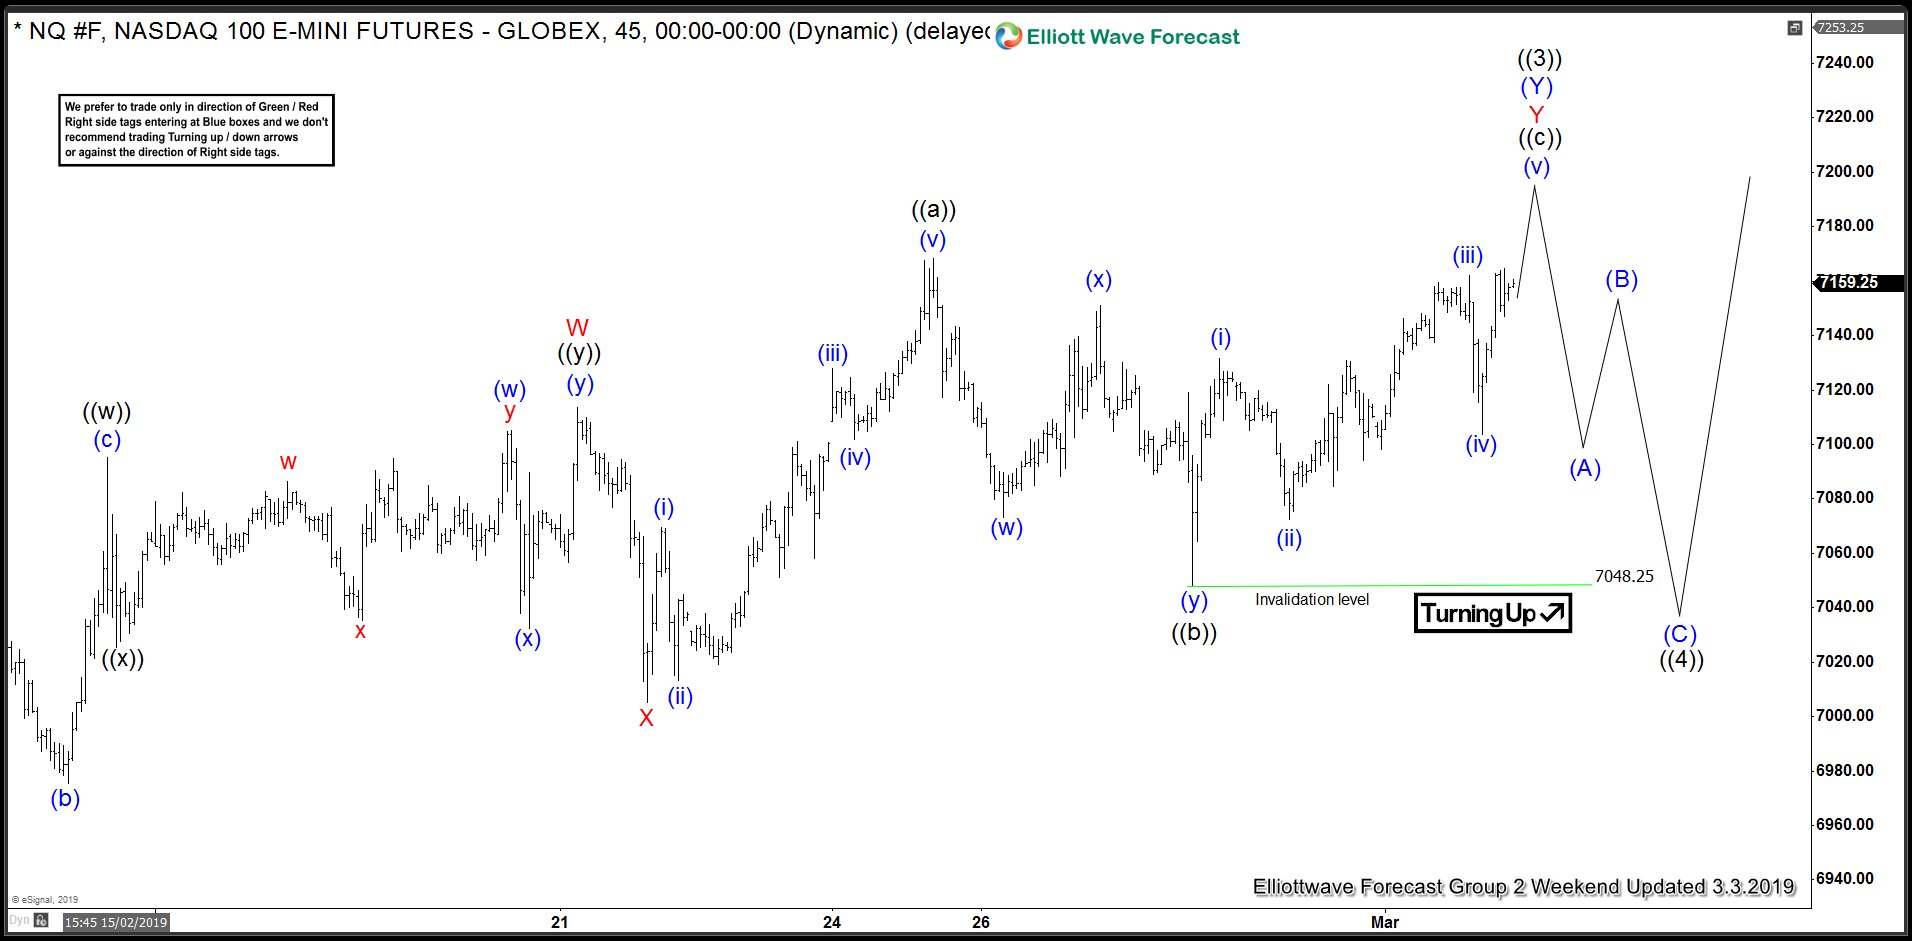
NASDAQ 1 Hour Elliott Wave Analysis 3.3.2019
Eventually NASDAQ has reached Blue Box area at 7056.95-6998.04.and found buyers there. Short term pull back ended at 7048.25 low and we’re getting rally as expected. Now any longs from Blue Box areas are should be risk free. If not already long we would rather avoid chasing strength at this stage. Count has been change due to Market Correlation with other world indexes. This counts fits better at this stage as we have DAX, NIKKEI, STX now ending 5th swing in equivalent cycle from the December’s 2018 low. More on that topic we explain in our Live Sessions and Chat Rooms .
Note: Market is dynamic and presented view could have changed in the mean time. Best instruments to trade are those having incomplete bullish or bearish swings sequences. We put them in Sequence Report and best among them are shown in the Live Trading Room.