Hello fellow traders. In this technical blog we’re going to take a quick look at the Elliott Wave charts of OIL. As our members know we were calling for further strength in OIL lately. Pull back against the December’s 26th low ended at 51.24 low as Irregular Elliott Wave Pattern and we’re now in the next leg higher. In the following article, we’re going to explain the Elliott wave Pattern and Forecast.
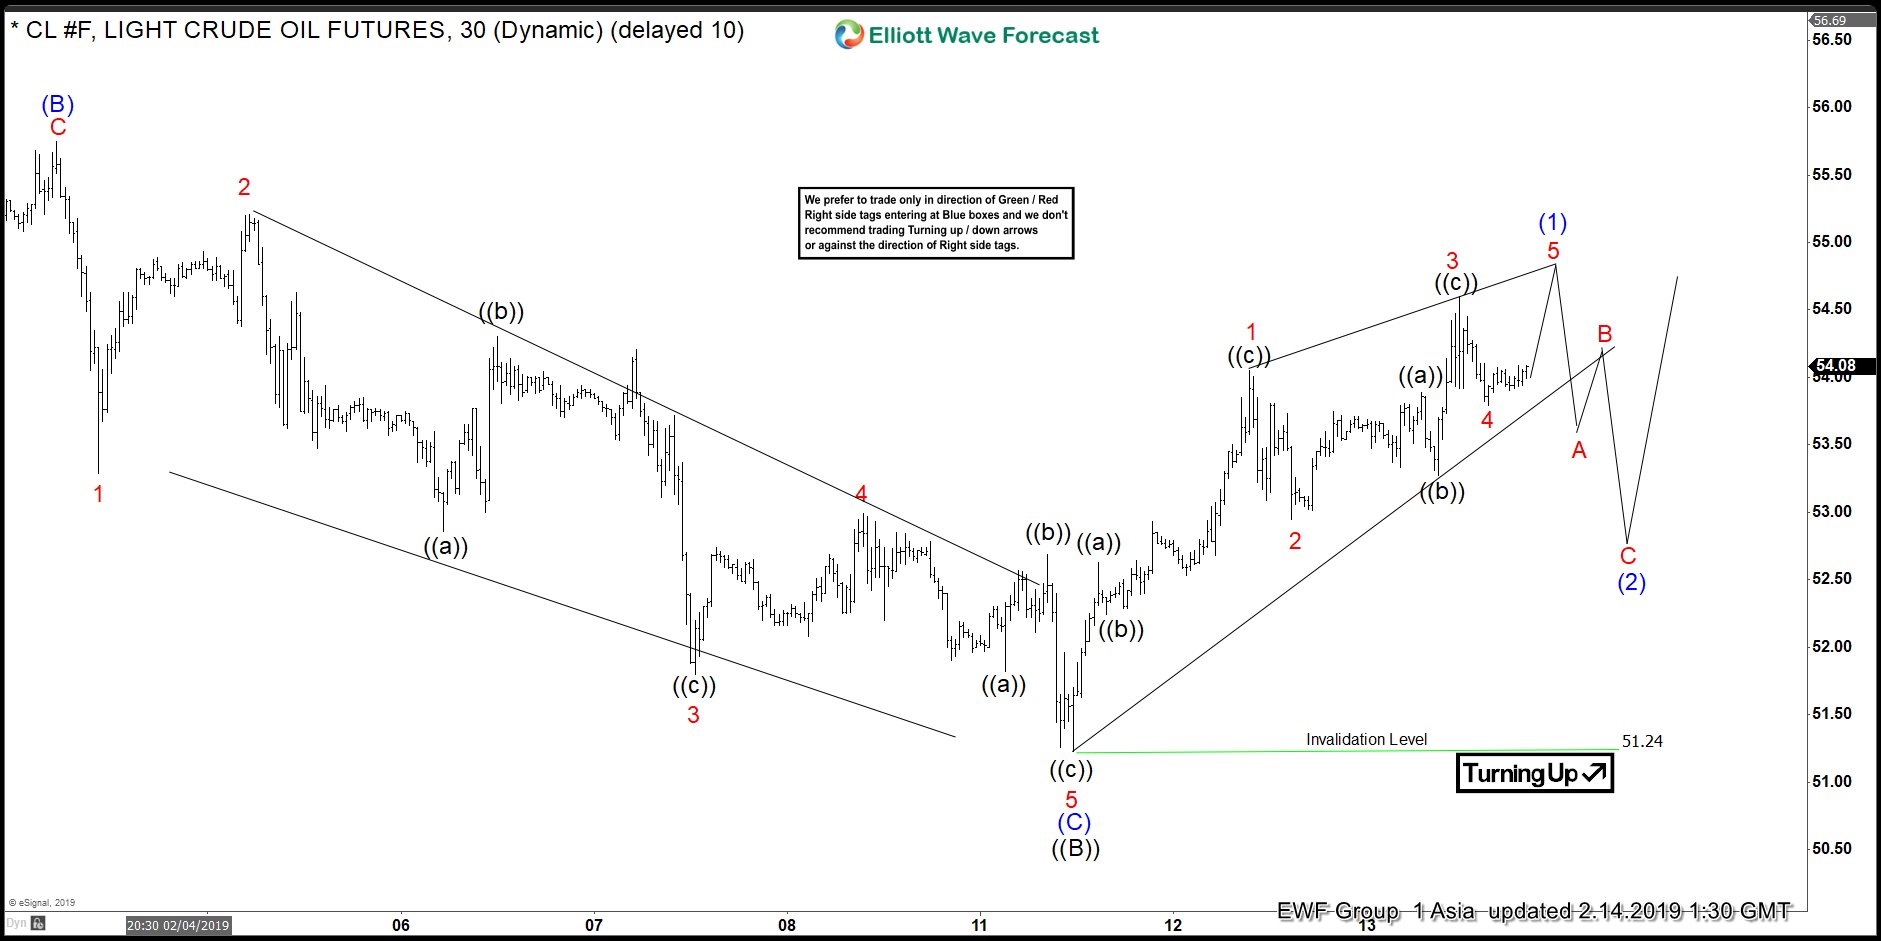
OIL 1 Hour Elliott Wave Asia Analysis 02.14.2019
Short term cycle from the 51.24 seems to be unfolding as Elliott Wave Leading Diagonal Pattern, when wave 1 was extended. We’re looking for another short term high – wave 5 red to complete proposed pattern as wave (1) blue. Then pull back (2) should ideally correct the short term rally from the 51.24 low . As soon as wave (2) completes we expect more strength in OIL and further separation from the 51.24 low.
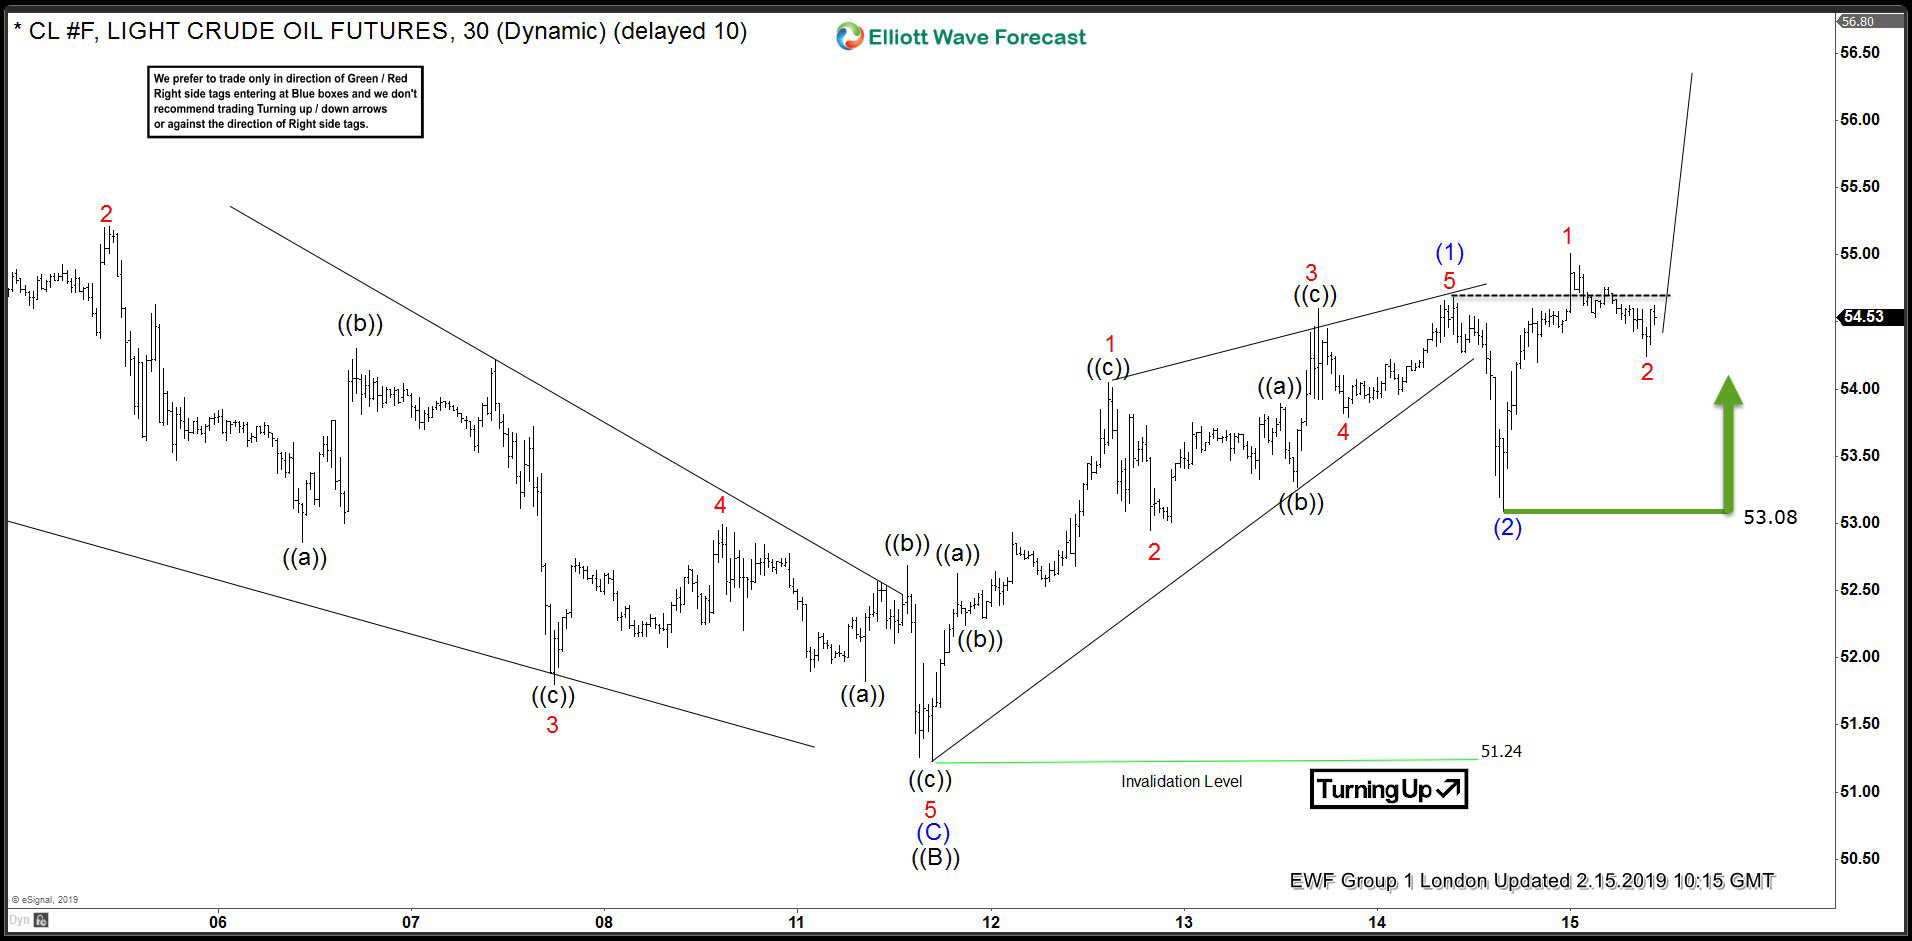
OIL 1 Hour Elliott Wave London Analysis 02.15.2019
In the meantime OIL has ended Leading Diagonal as expected. We got pull back in wave (2) against the 51.24 low, and then rally which has made new short term high. Now the price structure from the 51.24 low is showing Higher- High sequences. That break has made OIL is bullish against the 53.1 low. We got confirmation next leg up is in progress and calling for further rally within the cycle from the 51.24 low.
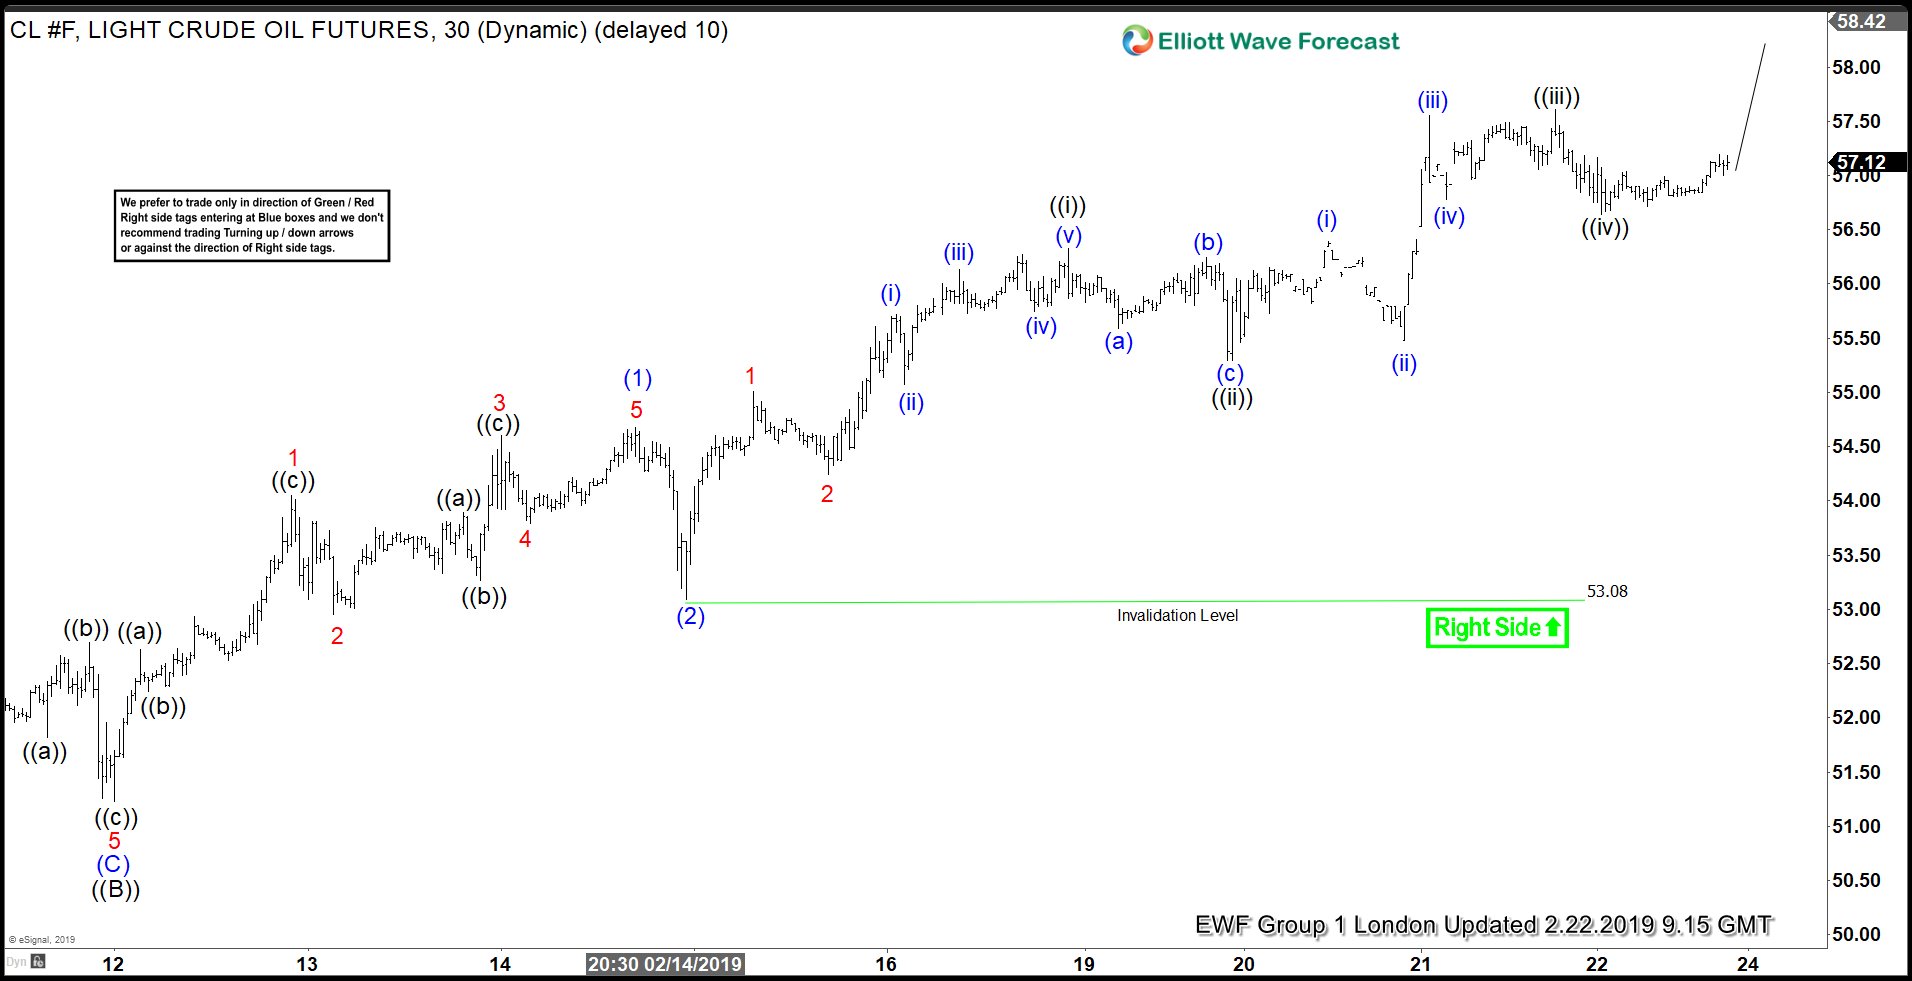
OIL 1 Hour Elliott Wave London Analysis 02.22.2019
53.08 short term low has held nicely and we got proposed rally. As far as we’re getting shallow pull backs wave (3) blue can remain in progress as shown on the chart. We don’t recommend selling and expect more strength in OIL.
Keep in mind that market is dynamic and presented view could have changed in the mean time. You can check most recent charts in the membership area of the site. Best instruments to trade are those having incomplete bullish or bearish swings sequences. We put them in Sequence Report and best among them are shown in the Live Trading Room.