
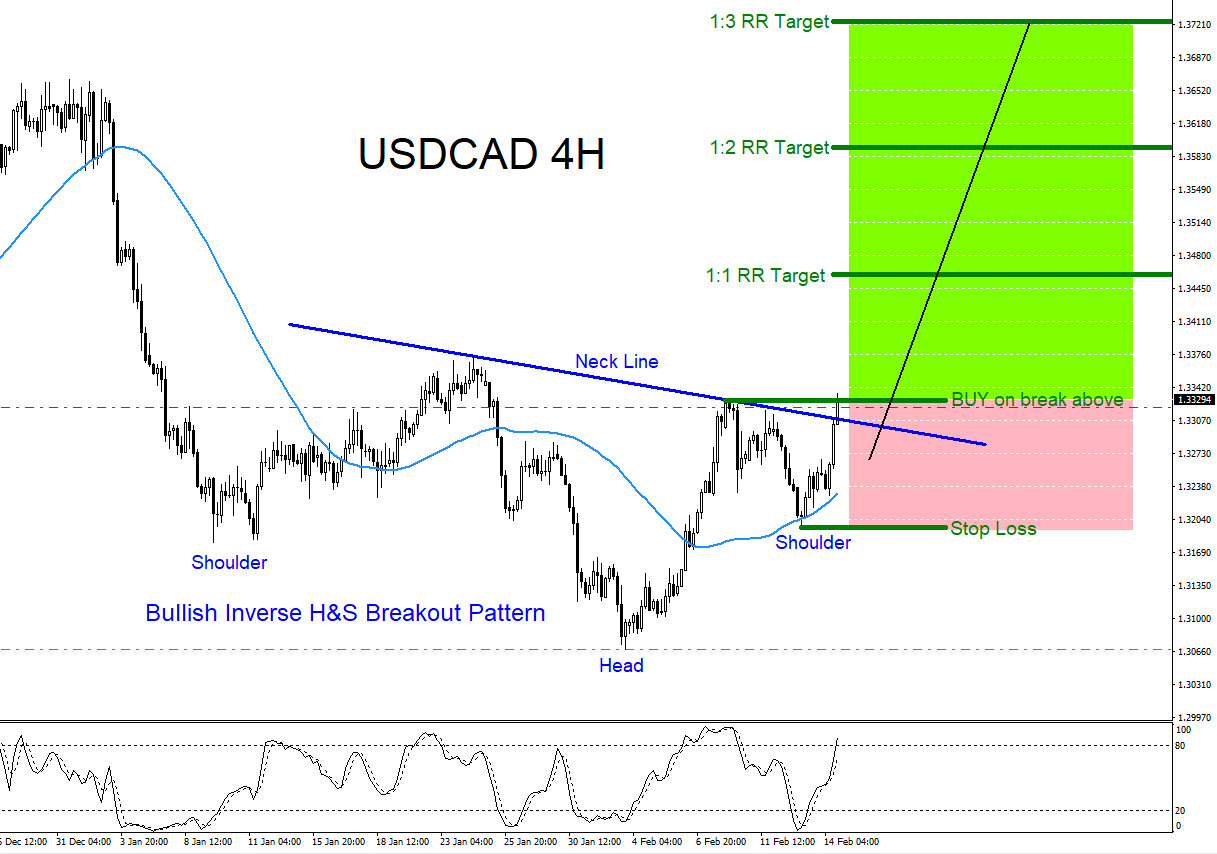
USDCAD BUY/LONG Trade Setup: USDCAD is forming a bullish inverted Head and Shoulders market breakout pattern. Price has already broke above the neck line which can be a signal that possibly more bulls will be entering LONGS and will start pushing the pair higher. Traders should watch for a good strong break above the green BUY breakout trend line. A good break above this level can send USDCAD higher and possibly extend to newer highs above the December 2018 high. If looking to BUY USDCAD look to buy on a good break above the green BUY entry trend line with Stop Loss at the low of the right shoulder and watching for price to hit the target levels as shown in the chart below. As long as the low of the right shoulder holds then a rally higher can be strongly possible. A break above the January 24/2019 high will confirm bulls are in control. Only time will tell what the pair will do but as for now I remain bullish until otherwise. Trade what you see and squeeze the trigger if and when you see USDCAD start to move higher. Trade safe.
USDCAD 4 Hour Chart 2.14.2019
Of course, like any strategy/technique, there will be times when the strategy/technique fails so proper money/risk management should always be used on every trade. Hope you enjoyed this article.