
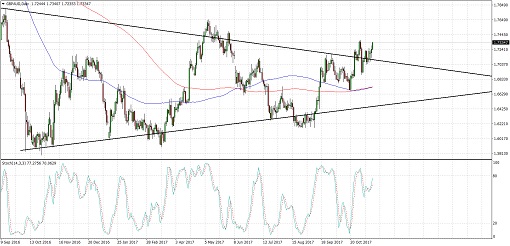
GBPAUD is slowly breaking above the resistance of its symmetrical triangle pattern on the daily time frame. This chart pattern is approximately 2000 pips tall so the resulting uptrend could be of the same height.
The 100 SMA has just crossed below the longer-term 200 SMA on this time frame but appears to be ready for another upward crossover that could draw bulls back in. Stochastic has been on the move down but is turning higher as well.
UK CPI came in weaker than expected for October as the reading held steady at 3.0% instead of improving to the estimated 3.1% figure. Core CPI was also unchanged at 2.7% instead of rising to 2.8%.
Traders are now waiting on the release of the claimant count change and the average earnings index for signs of wage growth. The index is slated to dip from 2.2% to 2.1% to signal weaker spending and inflationary pressures.
As for the Australian dollar, the currency was weighed down by downbeat Chinese industrial production and fixed asset investment which signaled slower demand for commodities. The Aussie also got hit by weaker than expected quarterly wage price index, which posted a 0.5% gain versus the estimated 0.7% increase. Australia’s jobs figures are due tomorrow.
By Kate Curtis from Trader’s Way