
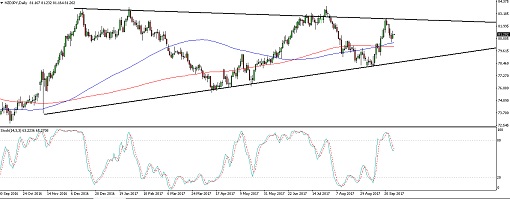
NZDJPY seems to be forming a triangle consolidation pattern visible on its daily time frame as it bounced off the 82.00 handle and is heading back to support around 79.00 to 79.50. Stochastic has turned lower from the overbought region to reflect a pickup in bearish pressure.
The 100 SMA has crossed above the longer-term 200 SMA to suggest that the path of least resistance is to the upside or that nearby support areas could hold. However, the moving averages are also oscillating to reflect a continuation of sideways price action.
As expected, the Reserve Bank of New Zealand kept interest rates unchanged at 1.75% and barely made any changes to their official announcement. While they acknowledged that the TWI has eased since their previous statement, they still emphasized that a lower Kiwi would be beneficial for tradeables inflation and balanced growth.
The central bank also acknowledged that growth has been in line with expectations for the June quarter, rebounding off the weak performance in previous quarters. Policymakers noted that inflation has also picked up then but could retreat again in the coming months.
As for the yen, the currency seems to be reacting to currency-specific factors and is also being dragged lower by dollar strength. The next batch of catalysts include the core CPI readings, household spending, retail sales, and preliminary industrial production numbers due on Friday’s Asian session.
By Kate Curtis from Trader’s Way