
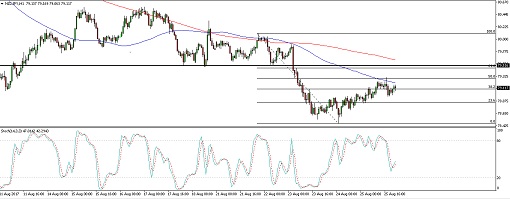
NZDJPY recently broke below support at the 79.50 minor psychological level then dipped to the 78.50 mark. Price pulled up from there and applying the Fibonacci retracement tool on the latest swing high and low on the 1-hour time frame shows that the 61.8% level lines up with the broken support.
The 100 SMA is below the longer-term 200 SMA so the path of least resistance is to the downside. In fact, the 100 SMA already seems to be holding as dynamic resistance at the moment since it lines up with the 50% Fib. A larger pullback could last until the 200 SMA just past 79.50.
Stochastic is on the move down so the pair might follow suit, but the oscillator also seems to be turning higher to suggest that Kiwi bulls aren’t giving in so easily.
Economic data from Japan turned out mixed last week, with the national core CPI advancing from 0.4% to 0.5% and the Tokyo core CPI beating expectations by posting a 0.4% gain. The services producer price index, however, came in short of expectations with a 0.6% gain versus the 0.8% consensus.
Japan is set to print its household spending report and unemployment rate on Tuesday. Retail sales and preliminary industrial production data are also lined up for the week. There are no major reports from New Zealand so market sentiment could be responsible for directing Kiwi price action.
By Kate Curtis from Trader’s Way