
Short Term Elliott Wave view in FTSE 100 Index suggests the rally from 4/20 low (7096.6) is unfolding as a zigzag Elliott Wave structure where Minute wave ((a)) ended at 7302.57 and Minute wave ((b)) ended at 7197.28. Subdivision of Minute wave ((a)) is unfolding as an impulse where Minuttte wave (i) ended at 7134.53, Minutte wave (ii) ended at 7104.22, Minutte wave (iii) ended at 7290.82, Minutte wave (iv) ended at 7262.32, and Minutte wave (v) of ((a)) ended at 7302.57. FTSE 100 has Index since broken above 7302.57 suggesting Minute wave ((c)) has started.
Minute wave ((c)) is unfolding as an ending diagonal where Minutte wave (i) ended at 7280.7, Minutte wave (ii) ended at 7222.81, Minutte wave (iii) ended at 7460.20, and Minutte wave (iv) ended at 7435.64. Index has reached 1.618 extension of the Minute ((a)) – ((b)) and thus cycle from 4/20 low is mature and we are calling Minor wave 1 completed at 7533.7. Minor wave (2) decline from there is unfolding in 3 swing where Minute wave ((w)) ended at 7478.88, Minute wave ((x)) ended at 7511.05, and Minute wave ((y)) of 2 is proposed complete at 7389.26. Near term, while pullbacks stay above 7389.26, and more importantly above 7096.6, expect FTSE 100 Index to extend higher. We don’t like selling the proposed pullback.
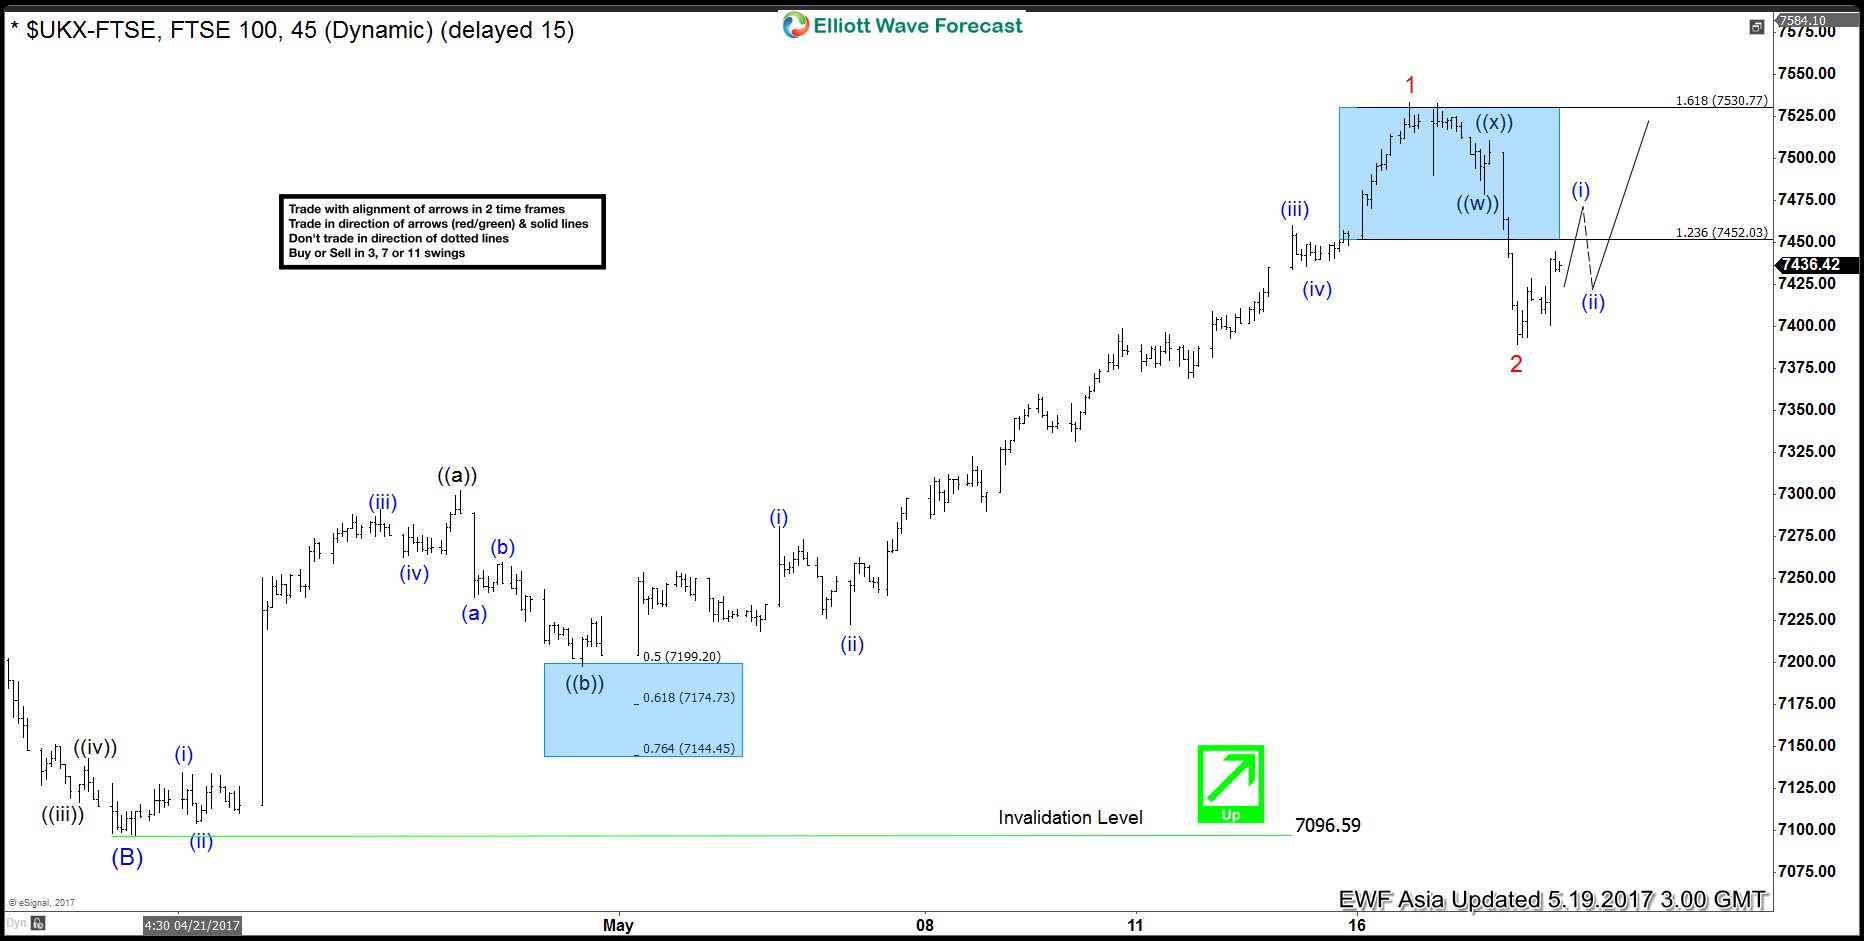
If FTSE 100 Index happens to break below 7389.26, this suggests the Index is still correcting within Minor wave 2 as 7 swing structure and this would open extension to the downside to the next 100% – 123.6% in 7 swing. In the event that this happens, the Index remains favored to continue the rally higher again after the 7 swing correction is completed as far as pivot at 7096.6 low remains intact.
FTSE 100 Index 1 Hour Elliott Wave Chart 05/19/2017
Source : https://elliottwave-forecast.com/stock-market/ftse-100-index-elliott-wave-correction