
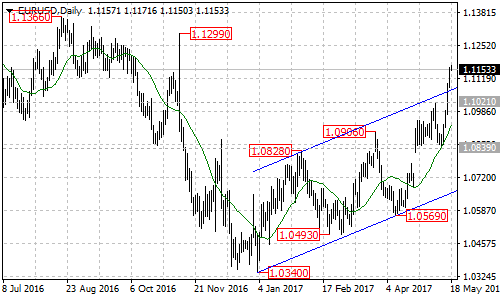
EURUSD broke above the upper line of the price channel on the daily chart, which provided resistance around 1.1060, indicating that a new bullish movement had started. Further rises could be expected over the next several days and next target would be at around 1.1460.
The near term supports
There is a 20 moving average on the daily chart with support around 1.0930, as long as the pair is above the moving average, the upward movement from 1.0569 could be expected to continue and only long positions should be taken until the 20 MA is broken below.
The next support level is at 1.0839 (May 11 low), a breakdown below this level will indicate that the upward movement from 1.0569 is complete, and this could trigger another fall towards the bottom of the price channel.
The key support
The key support for the long term uptrend from 1.0340 is located at the bottom trend line of the price channel, from 1.0340 (Jan 2017 low) to 1.0569 (Apr 2017 low); only a clear break below the channel support could signal completion of the long term uptrend.
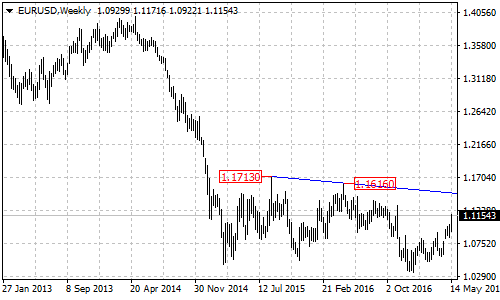
Trend line resistance on weekly chart
There is a descending trend line from 1.1713 (Aug 2015 high) to 1.1616 (May 2016 high) on the weekly chart which is acting as a resistance around 1.1460 for the bullish movement. Consolidation could be seen before breaking above this trend line resistance.
Technical levels
Support levels: 1.0930 (20 Moving Average), 1.0839 (May 11 low), the bottom of the price channel on the daily chart.
Resistance levels: 1.1299 (Nov 9, 2016 high), 1.1460 (the falling trend line on the weekly chart).