

AT&T (T) could stabilize in the coming months as its recent extreme area signals exhaustion. Moreover, the stock may attempt a steady recovery if buyers defend key support. Analysts expect gradual upside as long as the broader structure holds and momentum improves. Many experts highlight stronger free cash flow as a major pillar for future stability.
Additionally, cost‑cutting efforts and ongoing debt reduction may support sentiment through the next quarters. Several research desks project a slow but constructive rally as operational discipline strengthens. They also note that extreme zones often precede renewed bullish momentum. However, macro weakness could still limit short‑term gains, keeping the outlook cautiously optimistic.
Elliott Wave Outlook: AT&T (T) Weekly Chart Noviembre 2025
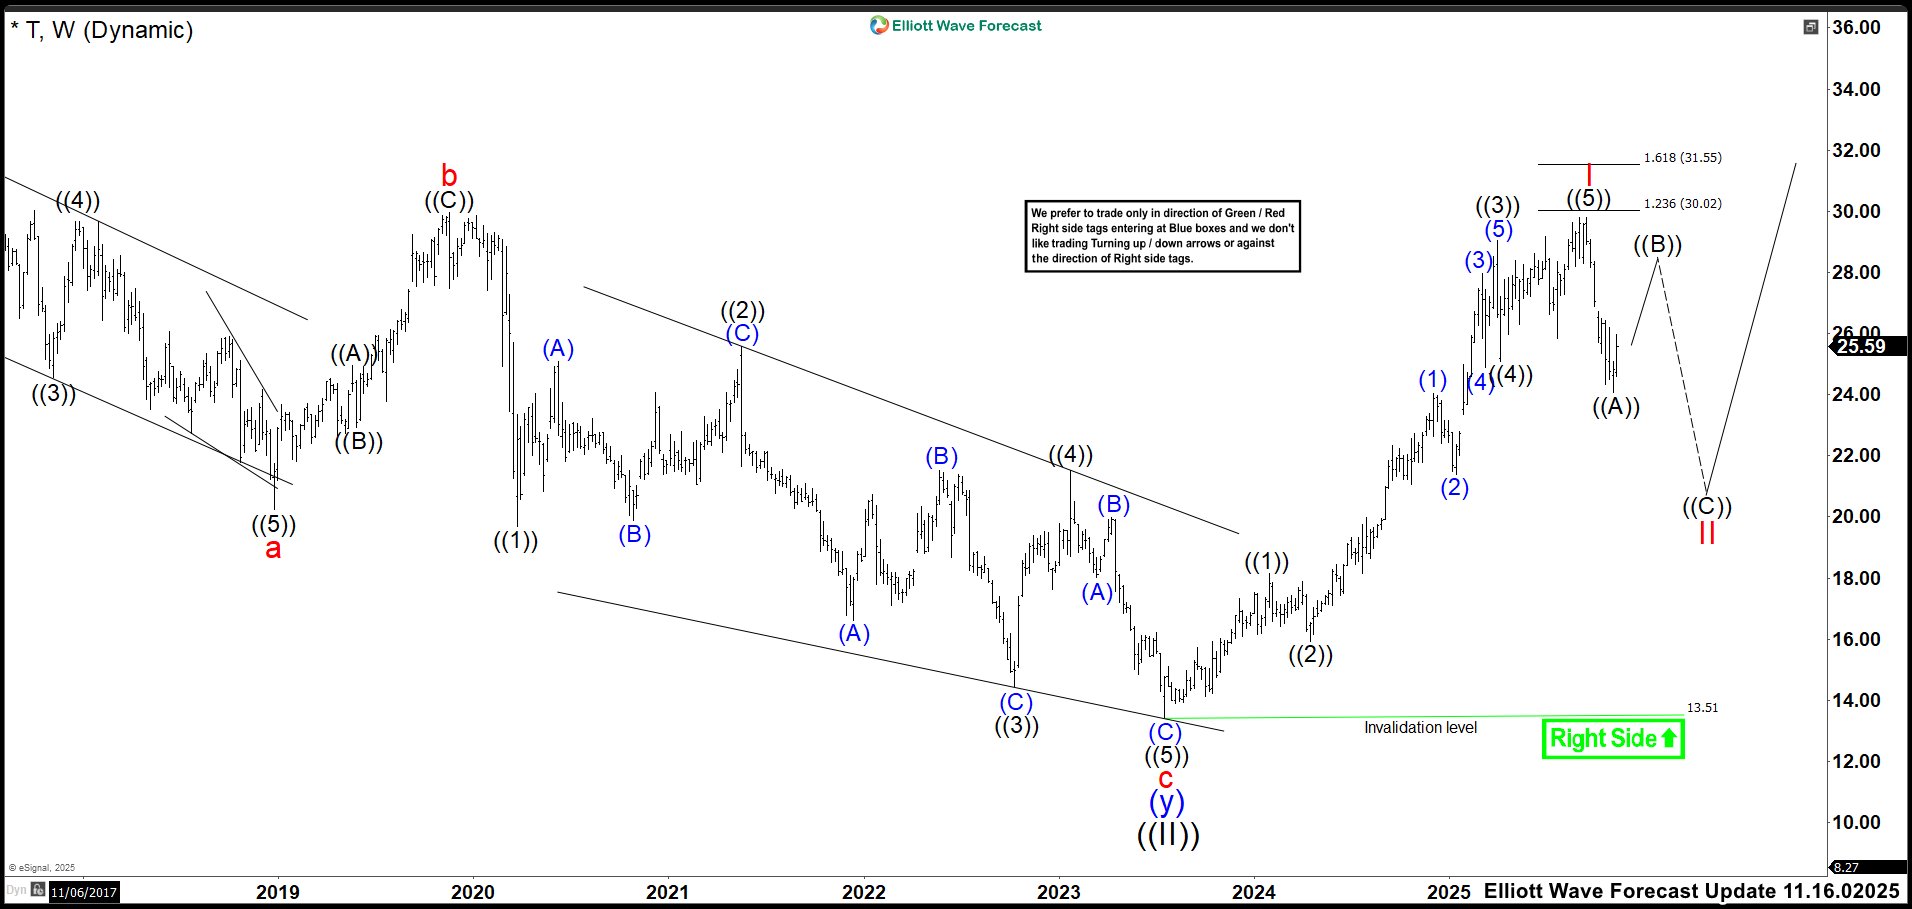
On September 15, 2025, T completed an impulse that began in 2023, reaching 29.79 per share. The price missed the ideal target zone by just a few cents. Wave ((5)) formed an ending diagonal, which finalized impulse wave I and triggered a reversal.
From that peak, the market declined into the expected 24 area. However, this drop represented only wave ((A)) of corrective wave II.
We expected a rebound in wave ((B)), with the recovery remaining capped below 29.79. Afterward, the market was expected to decline again in wave ((C)) of II. The ideal zone for the pullback to end was between 23.54 and 19.70. Within that range, we could look for new buying opportunities targeting a break above the wave I high of 29.79. (If you want to learn more about Elliott Wave Principle, please follow these links: Elliott Wave Education and Elliott Wave Theory.)
Elliott Wave Principle Behind the Market Structure
Impulse
An impulse is a clean 5‑wave pattern that drives the trend forward.
- Waves 1‑3‑5 are strong and directional.
- No overlap between waves 1 and 4.
- Wave 3 is usually the strongest.
- Structure is clear, with increasing momentum.
Elliott Wave Outlook: AT&T (T) Weekly Chart July 2026
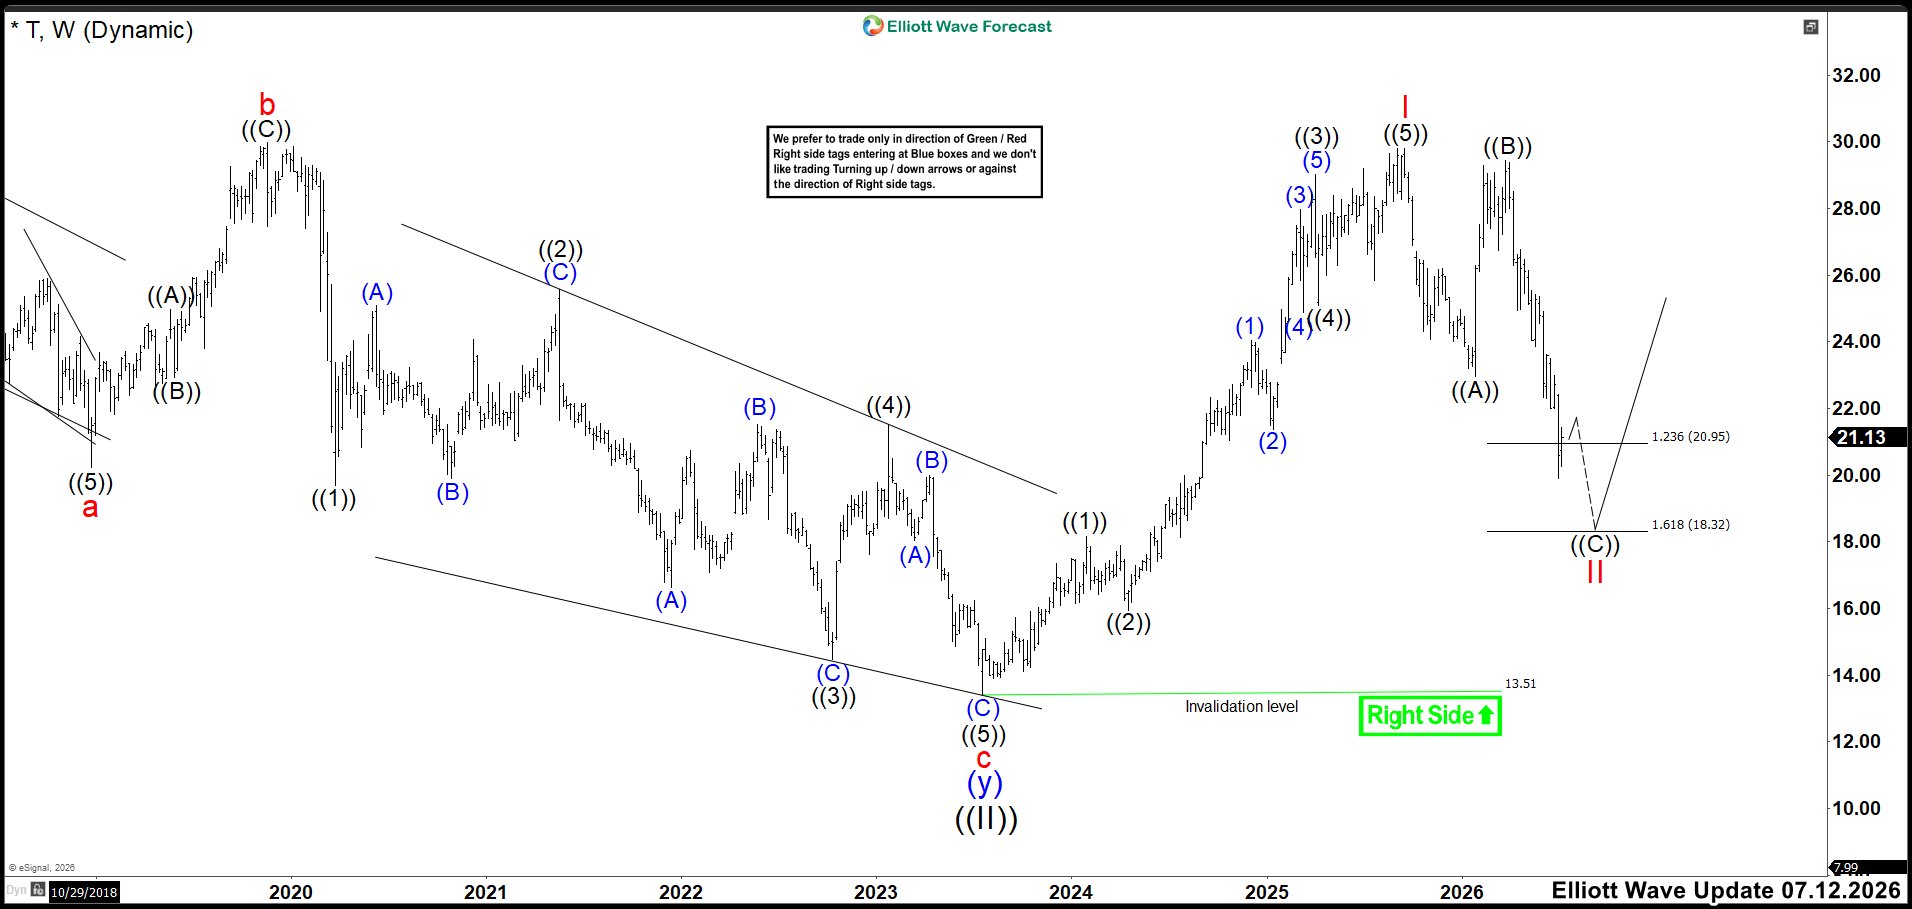
In this new update, T shows that the market broke below wave ((A)), confirming a flat correction in wave II. The price has already reached the extreme area at 20.95–18.32 and could continue the rally. However, because this is a flat correction, we cannot rule out a drop toward the 1.618 extension, meaning 18.32, before the rally resumes. The bullish idea remains valid as long as the market stays above 13.51.
Source: https://elliottwave-forecast.com/stock-market/t-hits-extreme-zone-ready-resume-rally/