Hello fellow traders. In this technical article, we take a quick look at the Elliott Wave charts of IWM iShares Russell 2000 ETF published in members area of the website. The ETF has recently given us Double Three pull back and found buyers again precisely at the equal legs area as we expected. In the following sections, we’ll break down the Elliott Wave structure in detail and explain the setup.
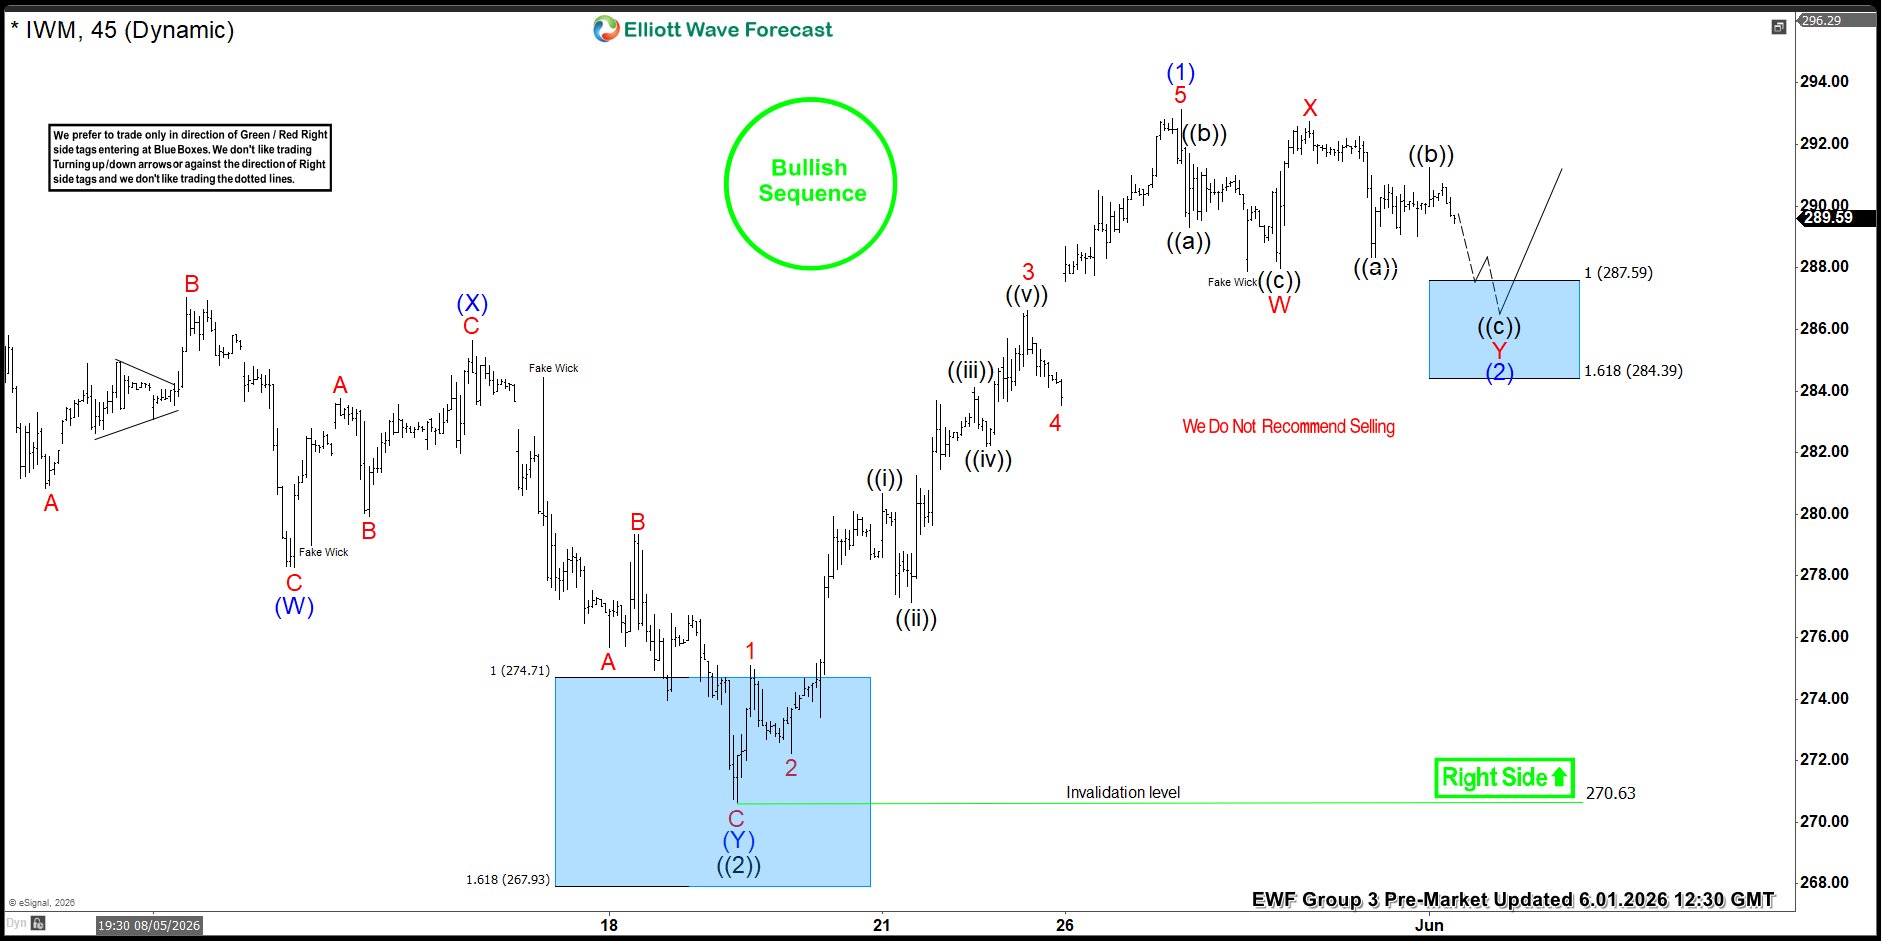
IWM Elliott Wave 1 Hour Chart 06.01.2026
The ETF is forming a 3-wave pullback, unfolding as a Double Three pattern. The structure suggests more weakness toward the Equal Legs area at 287.59-284.39. We expect at least a three-wave bounce from the Blue Box area. Once the price reaches the 50% Fibonacci retracement against the X red connector, we will make the position risk-free by moving the stop loss to breakeven and booking partial profits.
Official trading strategy on How to trade 3, 7, or 11 swing and equal leg is explained in details in Educational Video, available for members viewing inside the membership area.
90% of traders fail because they don’t understand market patterns. Are you in the top 10%? Test yourself with this advanced Elliott Wave Test
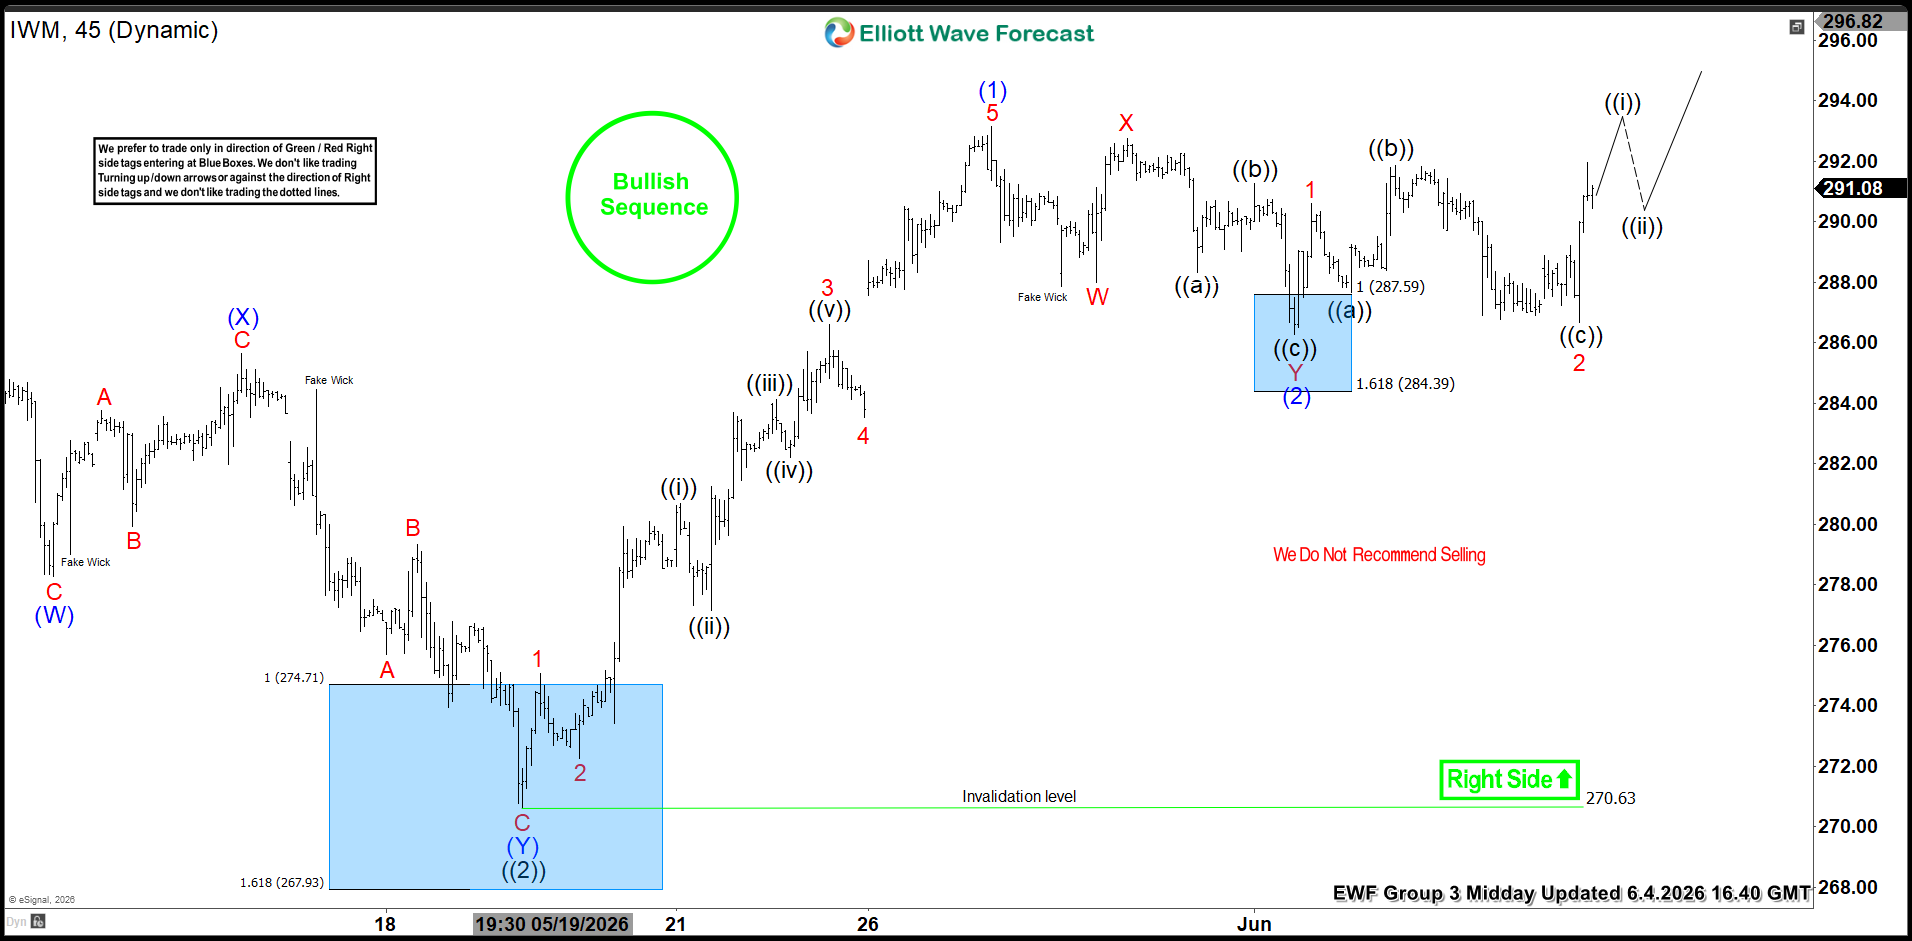
IWM Elliott Wave 1 Hour Chart 06.04.2026
The ETF completed correction above the invalidation level and made a decent reaction higher from our buying zone. As long as price holds above the 286.34 low , further upside remains likely. However, a break below 286.34 low would open the way for additional downside within the wave (2) correction.
Our member chat rooms are open 24/7 and provide ongoing expert guidance on market trends and Elliott Wave analysis. Members are encouraged to ask questions about market structure and technical setups at any time.
Source: https://elliottwave-forecast.com/stock-market/iwm-a-new-trading-setup-shared-with-members/