
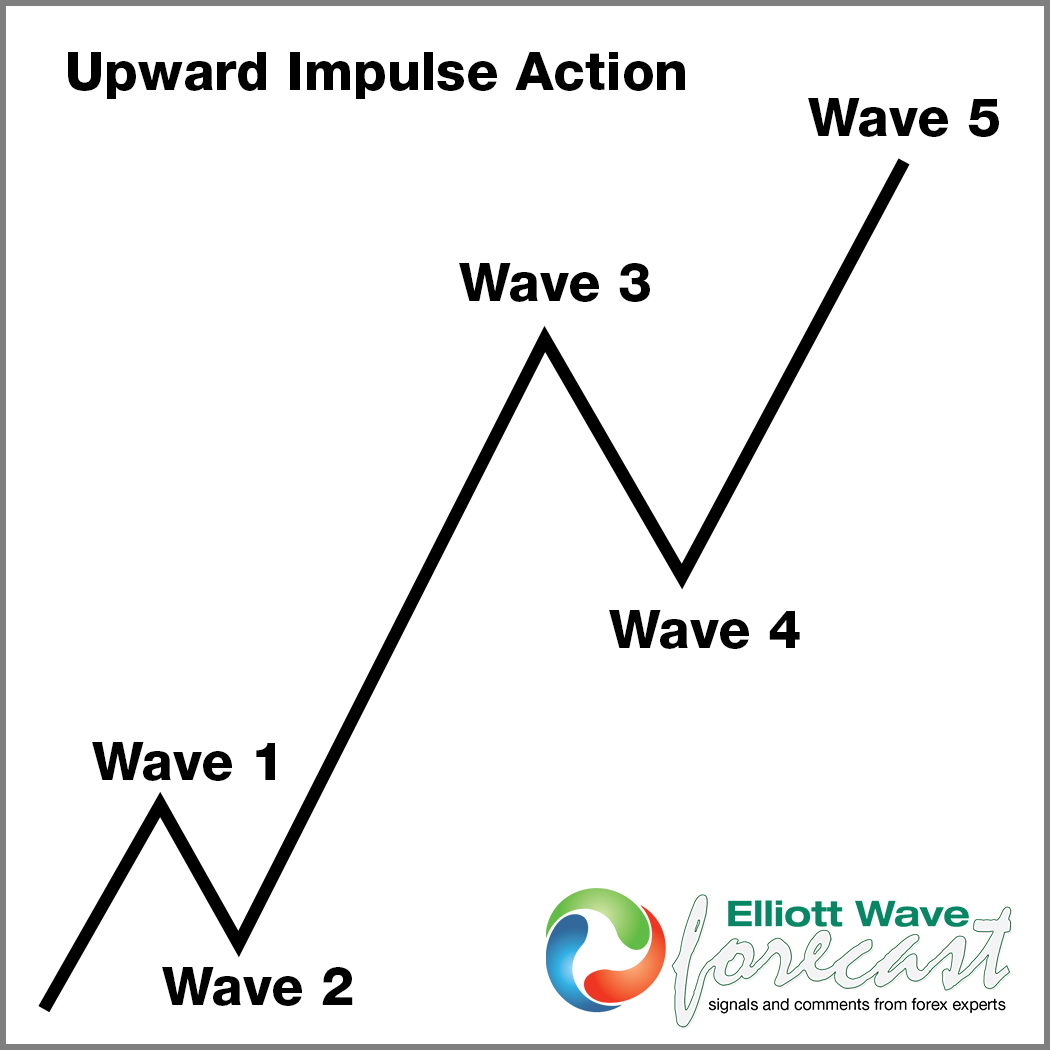
Hello everyone! In today’s article, we’ll examine the recent performance of Russell 2000 ETF ($IWM) through the lens of Elliott Wave Theory. We’ll review how the powerful rally from the November 2025 low unfolded as a textbook 5-wave impulse and discuss our evolving forecast for the next move. Let’s dive into the structure and expectations for this tech giant.
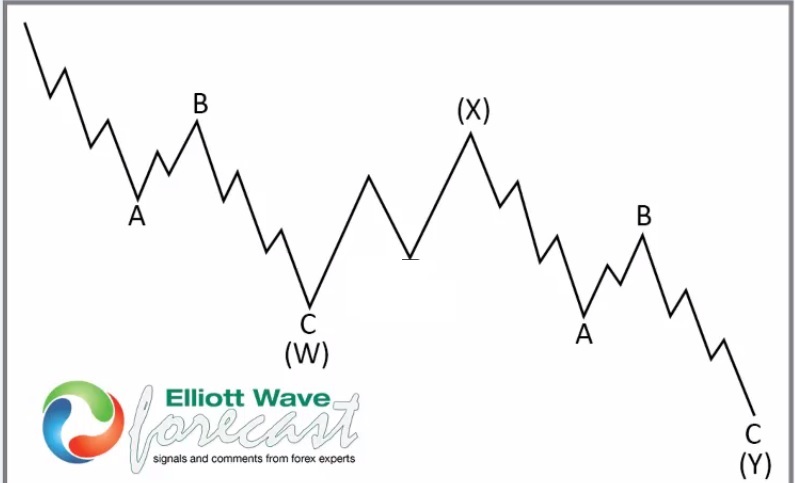
5 Wave Impulse + 7 Swing WXY correction
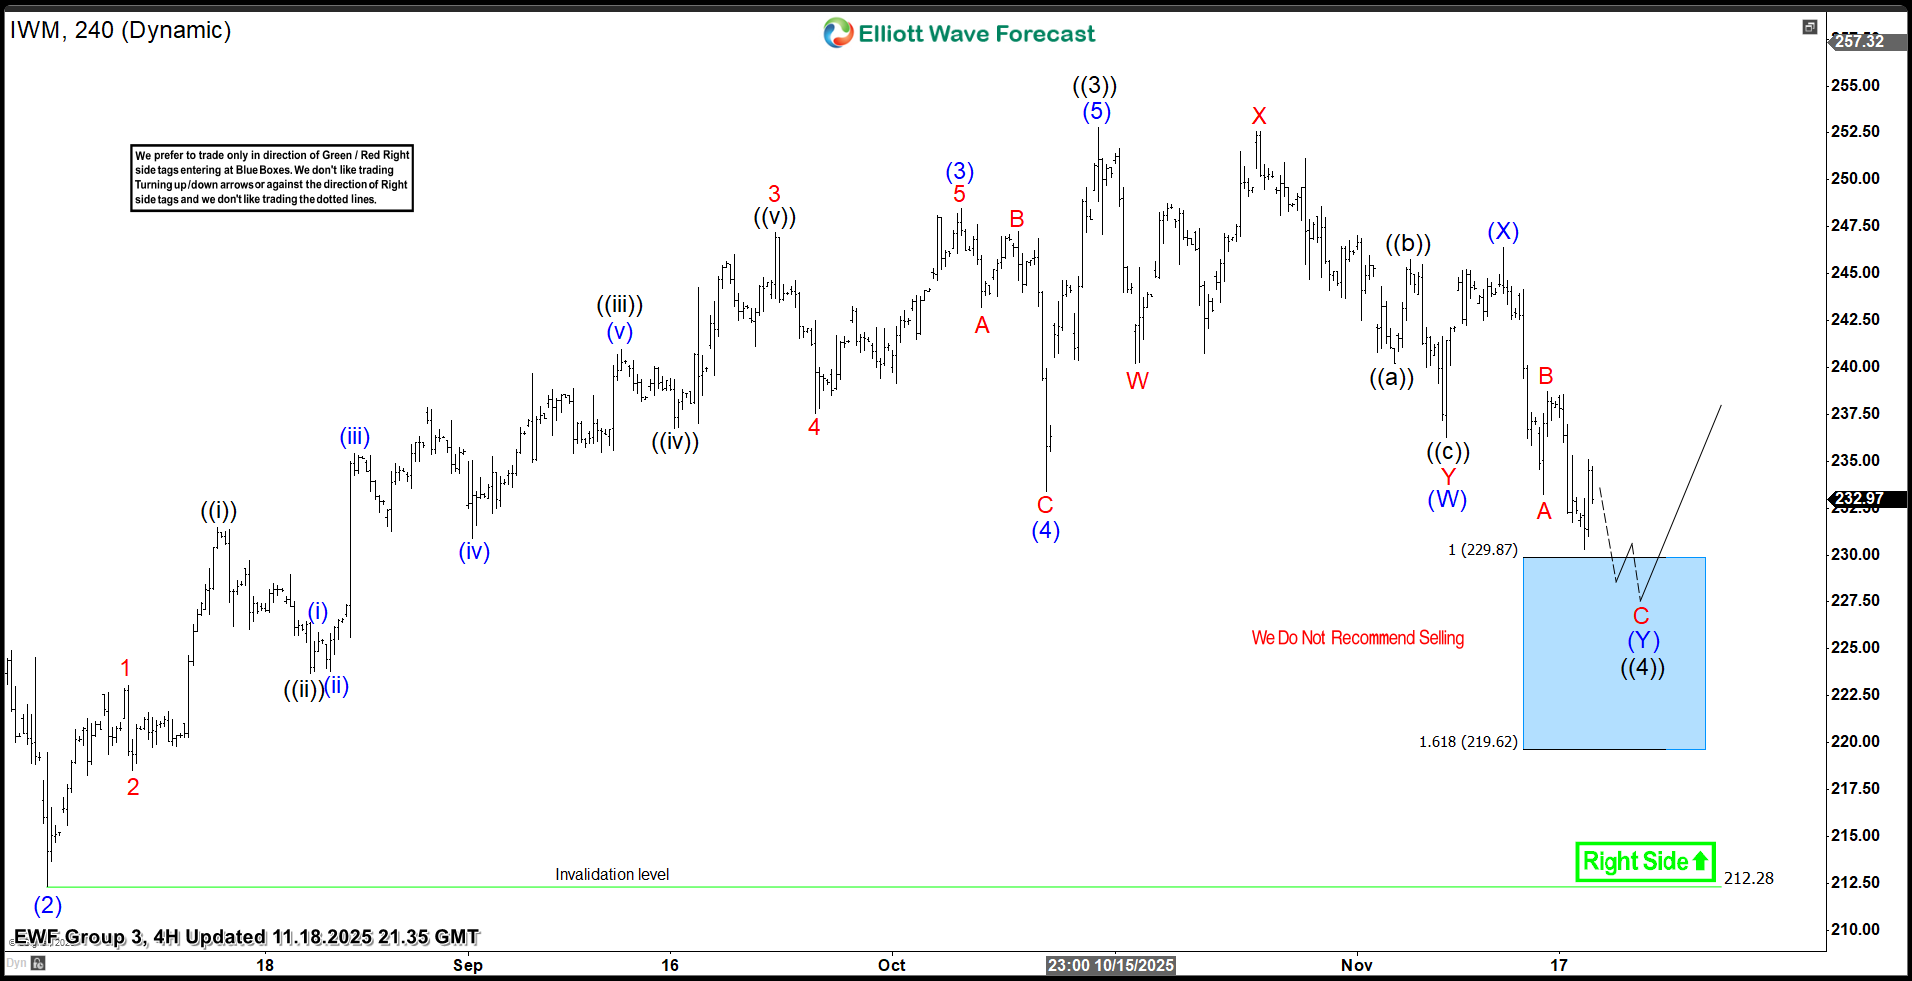
$IWM 4H Elliott Wave Chart 11.18.2025:
In the 4-hour Elliott Wave count from Nov 18, 2025, we saw that $IWM completed a 5-wave impulsive cycle at black ((3)). As expected, this initial wave prompted a pullback. We anticipated this pullback to unfold in 7 swings, likely finding buyers in the blue box equal legs area between $229.87 and $219.62.
$IWM 4H Elliott Wave Chart 12.08.2025:
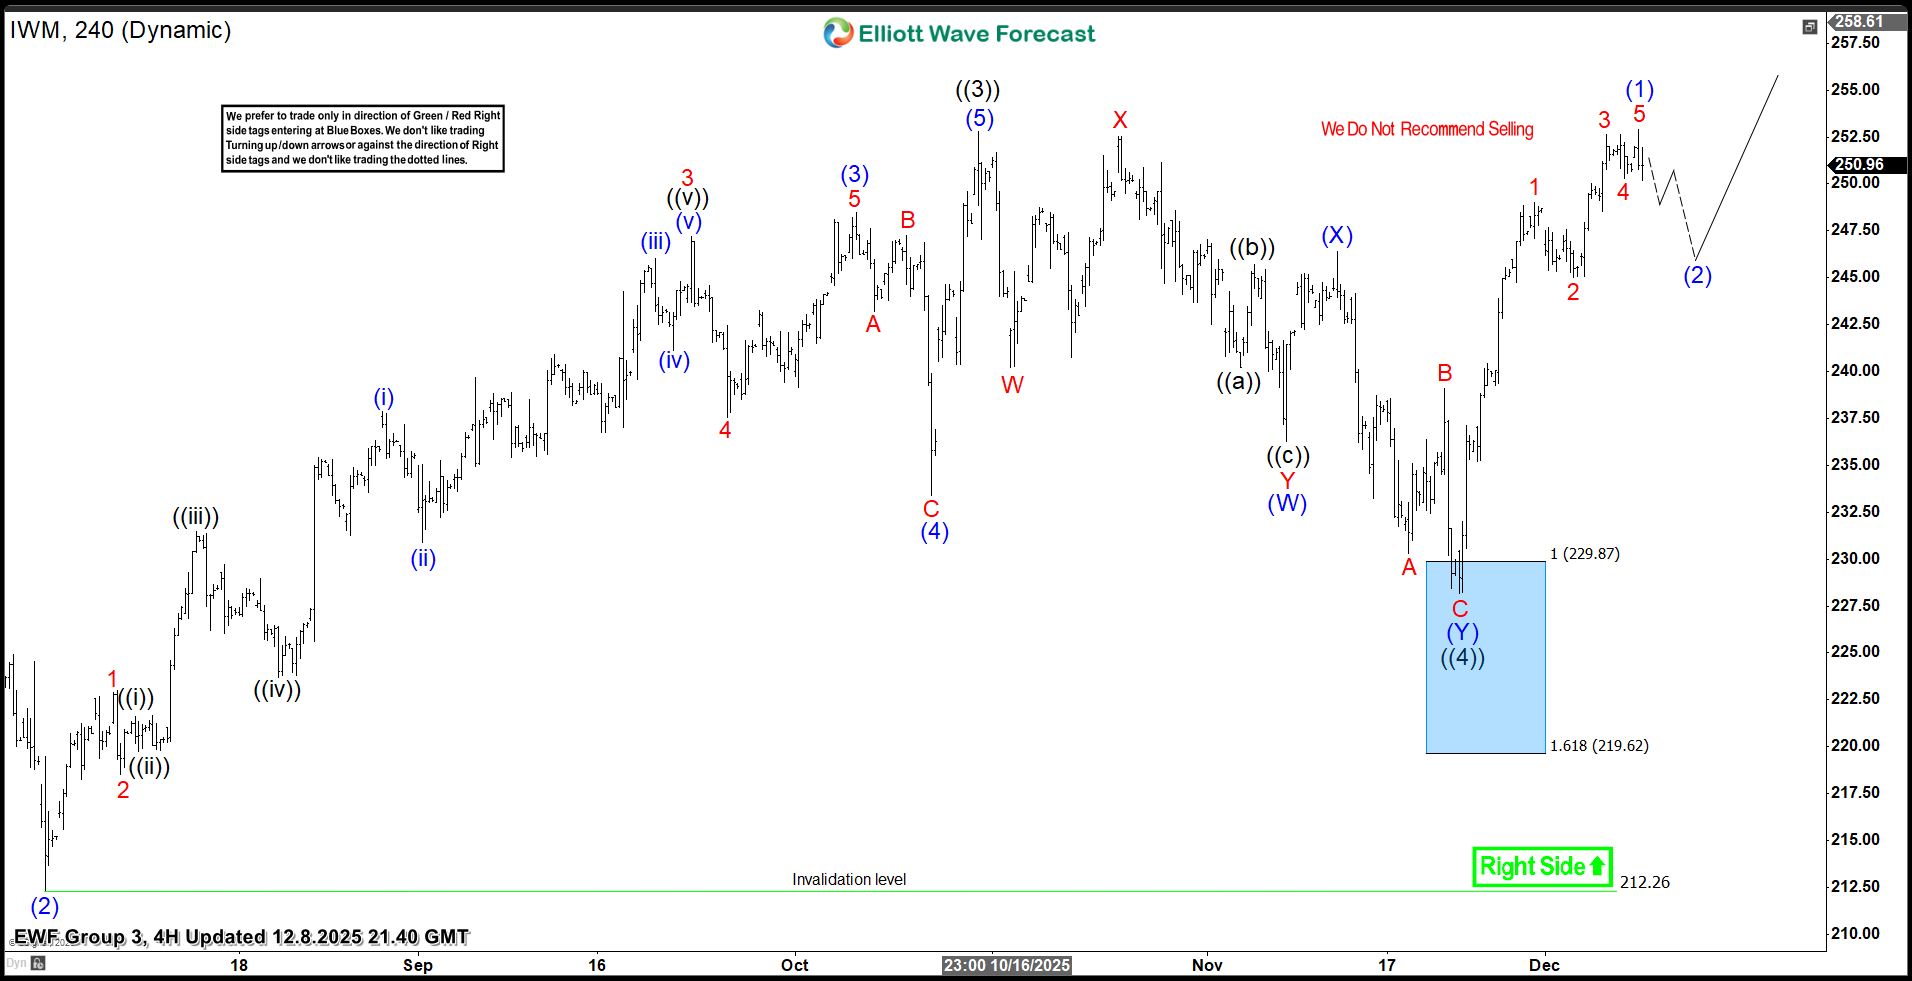
The latest update shows the strong reaction from the blue box area. The ETF was able to rally 11% and hit new all-time highs. Right now, the ETF is looking for a pullback to digest the recent gains and continue climbing. We think $IWM could reach $258–$268 next.
Conclusion
In conclusion, our Elliott Wave analysis of $IWM continues to prove accurate, suggesting that the ETF remains well-supported against its November 2025 lows. Therefore, for traders who capitalized on the entry opportunities presented in the “blue box” area, the $258–$268 zone should be closely monitored as the next significant objective. In the interim, keeping a vigilant eye out for any healthy corrective pullbacks could present fresh entry opportunities for those looking to join the trend.
Ultimately, by applying the principles of Elliott Wave Theory, traders can gain a deeper understanding of market cycles, better anticipate the structure of upcoming moves, and ultimately enhance their risk management strategies in dynamic markets like the current one for $IWM.