
Platinum (PL) shows a bullish sequence from March 2020 low, confirming the right side is higher. In this article, we will explore the latest long-term Elliott Wave technical outlook.
Platinum (PL) Monthly Elliott Wave Chart
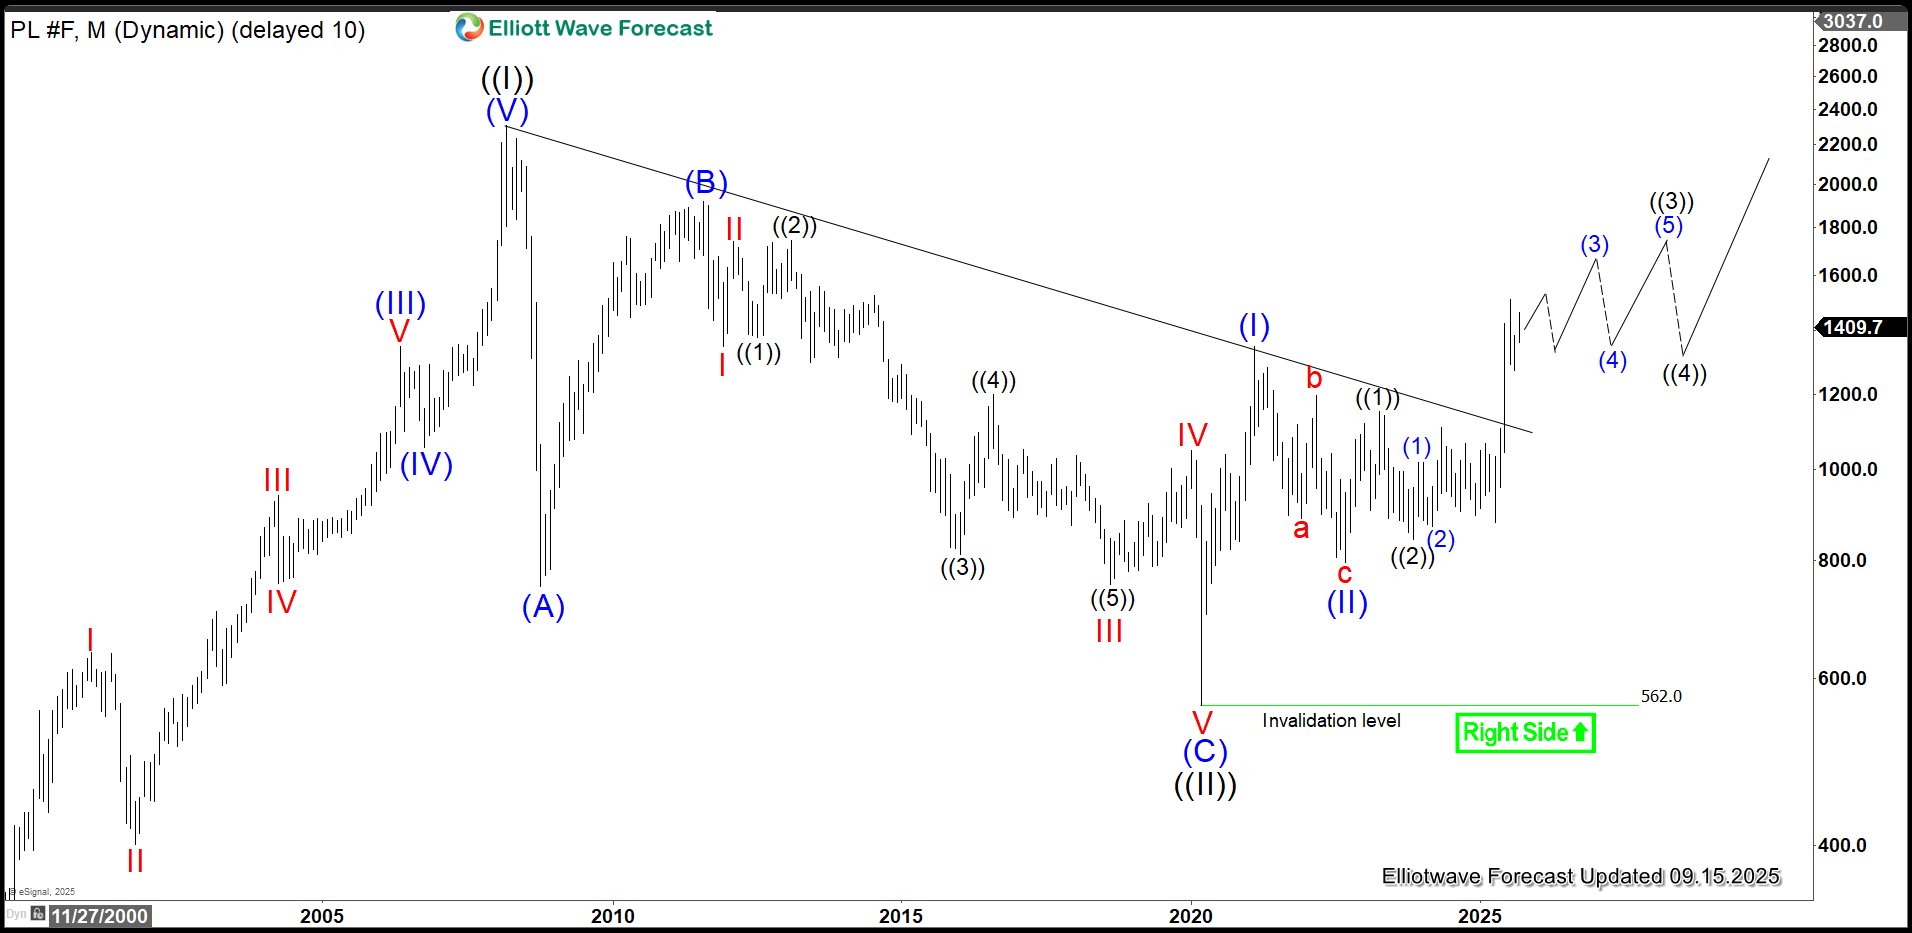
The monthly Platinum chart illustrates that the wave ((I)) rally peaked at 2308.8, followed by a wave ((II)) pullback that bottomed at 562. The pullback formed a zigzag Elliott Wave structure. From the wave ((I)) high, wave (A) declined to 752.1, wave (B) rallied to 1918.5, and wave (C) dropped to 562, completing wave ((II)) in a higher degree. The metal has since resumed its ascent in wave ((III)). From the wave ((II)) low, wave (I) reached 1348.2, with a wave (II) pullback concluding at 796.8. In the near term, as long as the 562 pivot low holds, the metal is expected to continue rising.
Platinum (PL) Daily Elliott Wave Chart
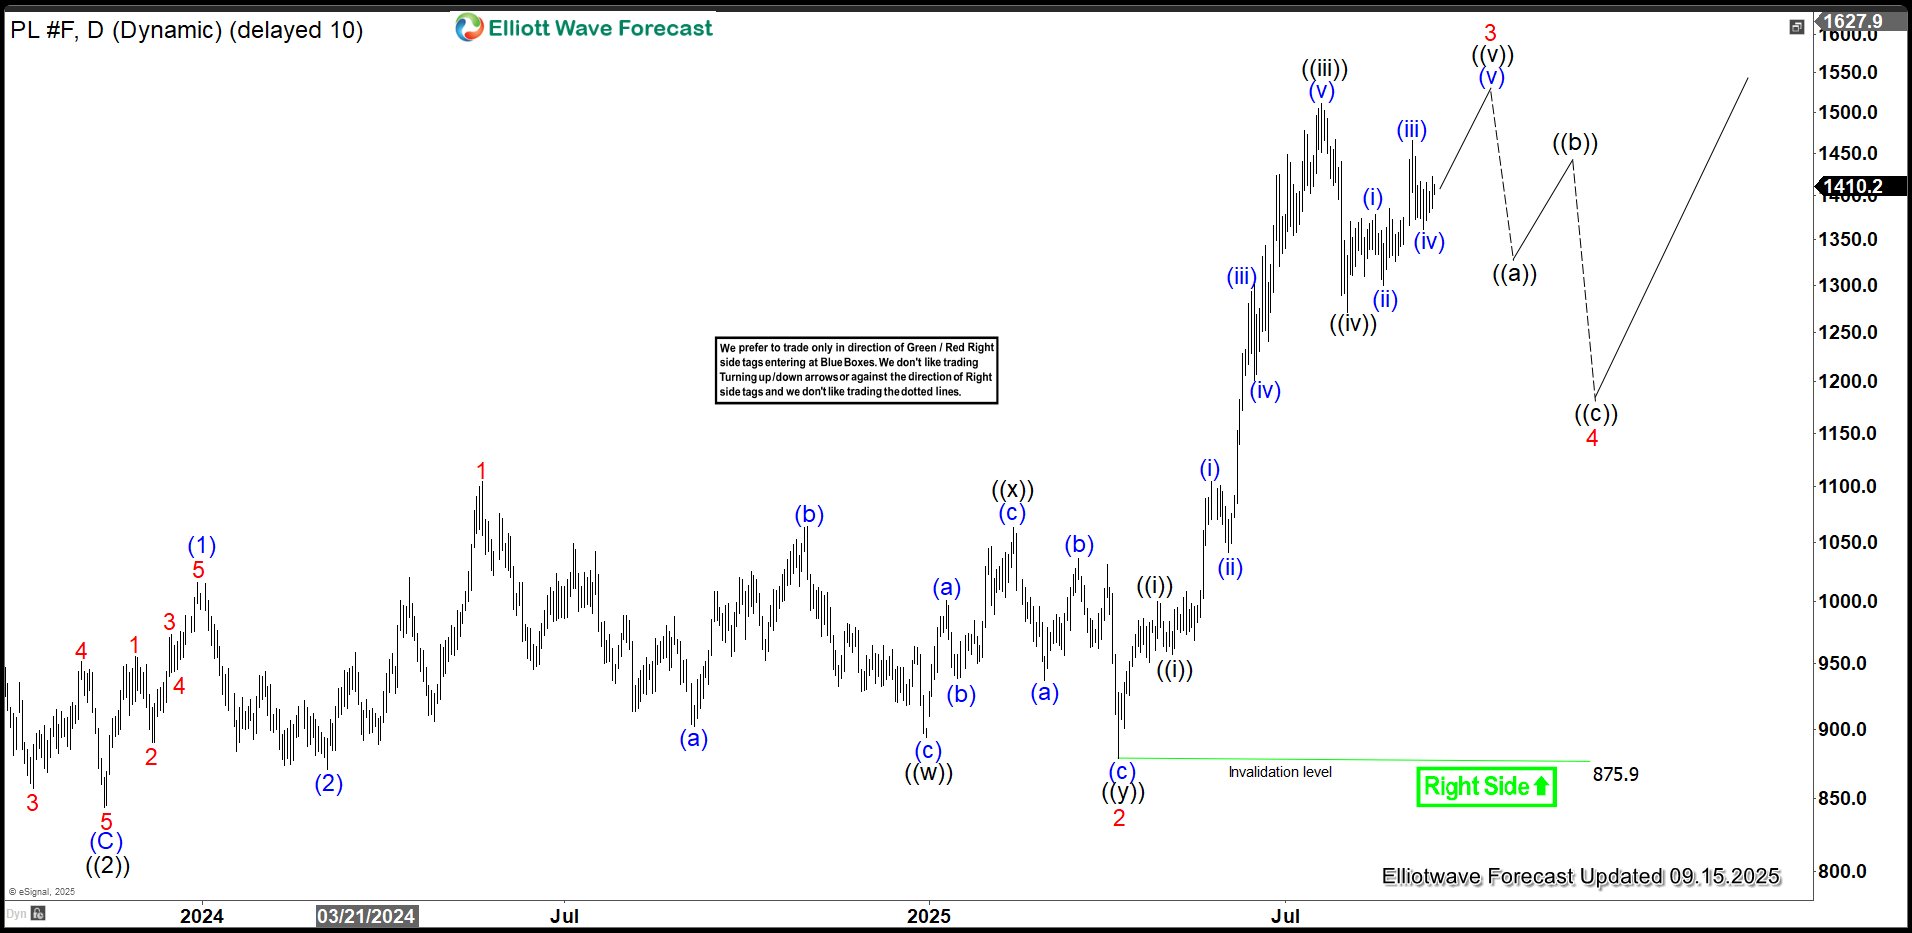
The daily Platinum chart shows that the wave ((2)) pullback ended at 843.1. From that low, the metal is nesting higher with wave (1) ended at 1016 and pullback in wave (2) ended at 870. Wave (3) higher is in progress as an impulse in lesser degree. Wave 1 of (3) peaked at 1105, followed by a wave 2 pullback concluding at 875.9. The metal has since resumed its upward trend in wave 3. In the near term, as long as the price stays above 875.9, expect Platinum to continue rising.
Source: https://elliottwave-forecast.com/commodities/platinum-pl-price-soars-in-strong-uptrend/