
Hello fellow traders. In this article we’re going to take a quick look at the Elliott Wave charts of the S&P 500 E-Mini (ES_F Futures) , published in the members area of the website.
As our members know, $ES_F is showing impulsive bullish sequences in the cycle from the 5959.31 low. Recently it pulled back and found buyers at the equal legs area. Here’s our Elliott Wave Forecast and what to expect next.
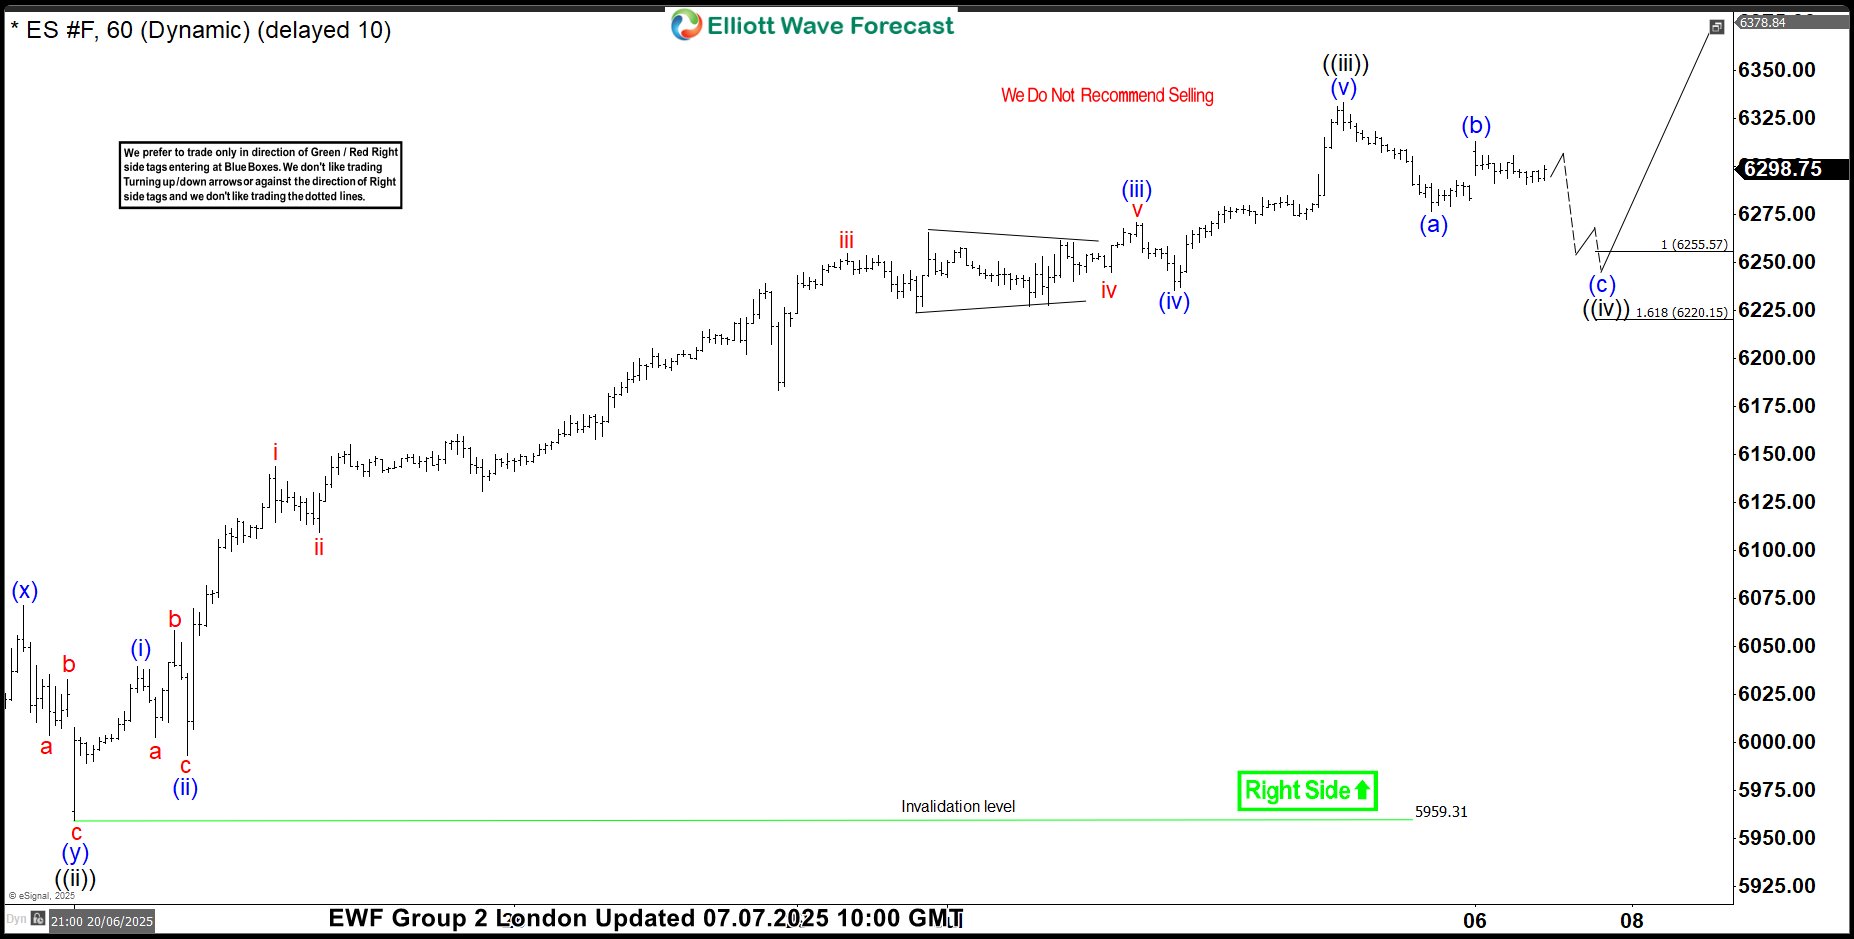
ES_F Elliott Wave 1 Hour Chart 07.07.2025
$ES_F is showing 5 waves up in the cycle from the 5959.31 low. Current view suggests that the cycle could already be completed and now doing a pullback, wave ((iv)). As of now, we count 5 waves in the decline from the peak, suggesting we’ve seen only the first leg of the ((iv)) pullback, which is unfolding as an Elliott Wave zigzag pattern. As long as the price stays below the (b) peak, $ES_F is likely now in the final (c) leg of the correction. We expect the decline toward the 6255.57–6220.15 ( buyers area) to complete wave ((iv)) black before the bullish trend resumes.
Did you know? 90% of traders fail because they don’t understand market patterns. Are you in the top 10%? Test yourself with this advanced Elliott Wave Test
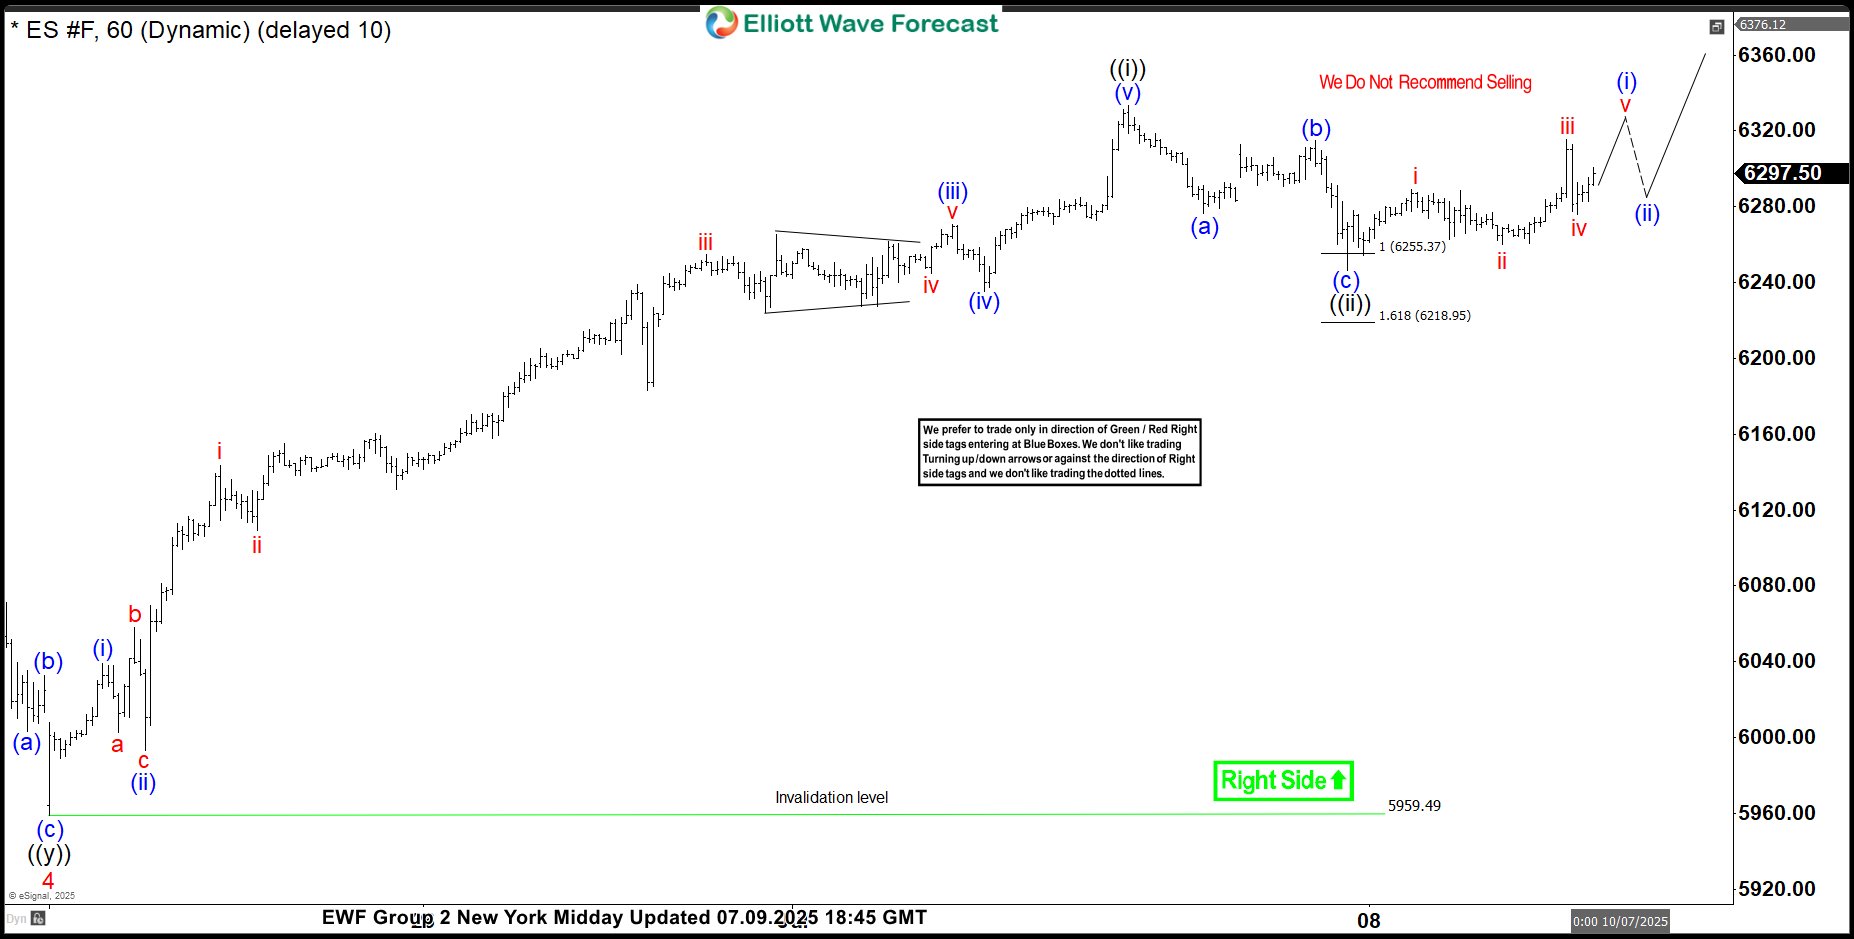
ES_F Elliott Wave 1 Hour Chart 07.09.2025
ES_F made another leg down, following a 5-wave structure toward the extreme zone. It found buyers and turned higher as expected. Now, we’d like to see a break above the July 3rd peak, which will confirm further extension to the upside. The futures should ideally remain supported as long as the pivot at the 5959.4 low holds.
Reminder for members: Our chat rooms in the membership area are available 24 hours a day, providing expert insights on market trends and Elliott Wave analysis. Don’t hesitate to reach out with any questions about the market, Elliott Wave patterns, or technical analysis. We’re here to help.
Source: https://elliottwave-forecast.com/stock-market/sp-500-e-mini-es_f-found-buyers/