
Hello everyone! In today’s article, we’ll examine the recent performance of SPDR Metals & Mining ETF ($XME) through the lens of Elliott Wave Theory. We’ll review how the reaction from the April 2025 blue box areas unfolded as an impulsive 5 waves and discuss what’s next. Let’s dive into the structure and expectations for this ETF.
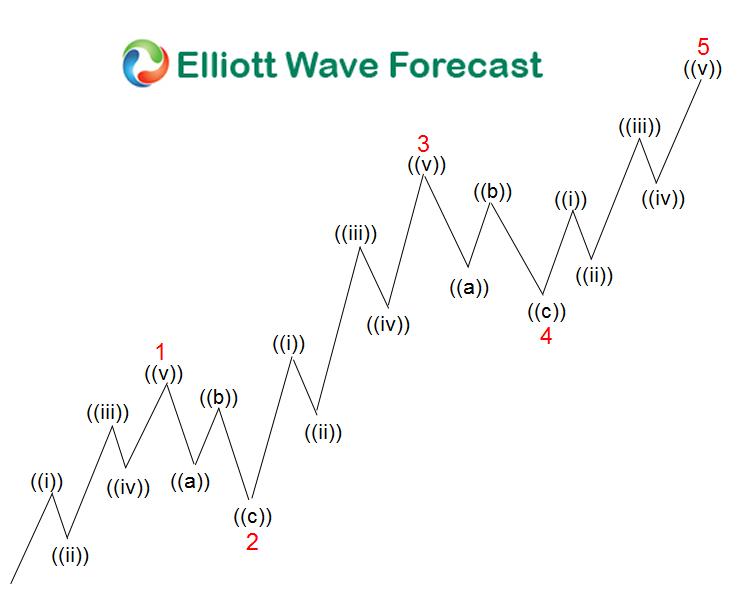
5 Wave Impulse Structure
The April 2025 Setup

The above chart illustrates our Elliott Wave forecast for $XME as of April 2025. At this point, $XME was depicted as completed a potential wave (II) correction, specifically reaching a blue box area between approximately $48.07 and $38.93. This blue box represented a high-probability reversal zone, calculated using Fibonacci extensions (1.236 and 1.618 respectively, of prior waves). The label “Turning Up” near the bottom of the blue box, along with an “Invalidation Level” at $38.93, signaled our expectation for a significant bounce.
The July 2025 Soar
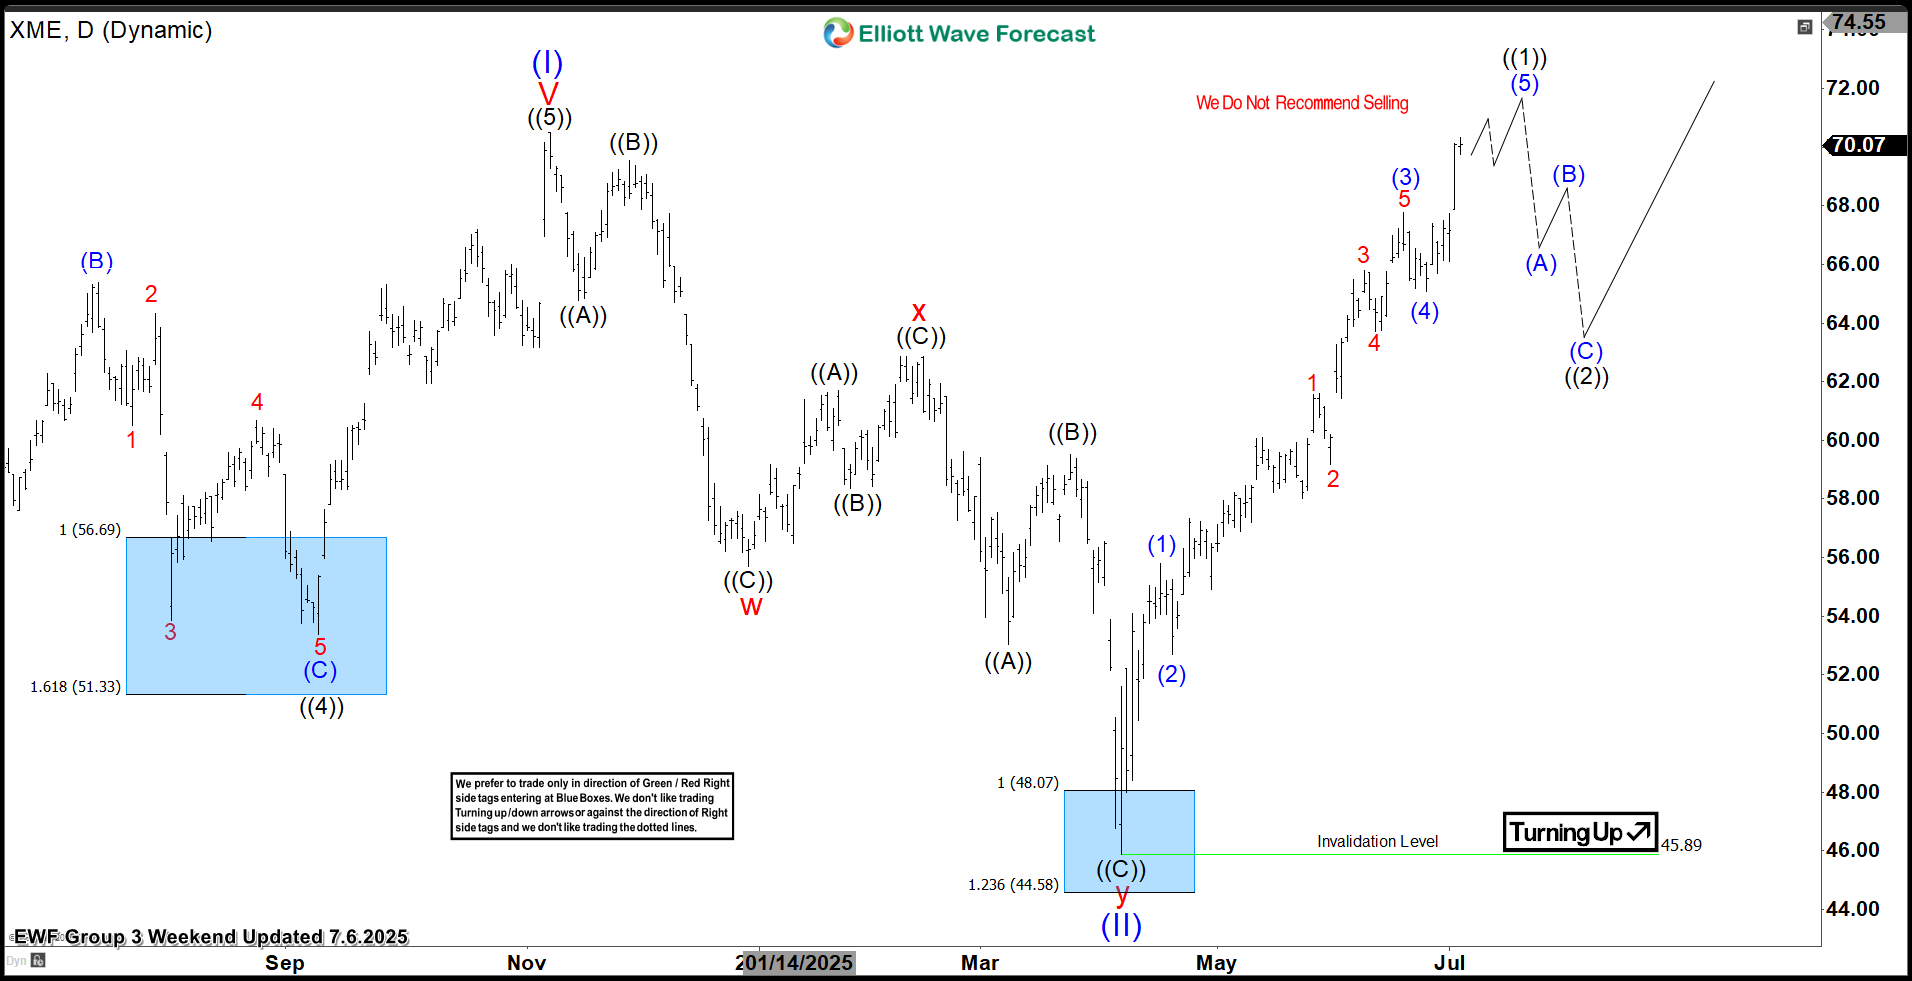
Fast forward to July 6, 2025, as seen above. This chart strikingly demonstrates the strong reaction from the April 2025 blue box area. From the low within the blue box, XME has indeed surged, exhibiting a clear five-wave impulsive structure. Comparing the two charts, the most significant extension higher is evident in the current price action. In the April chart, the market was still in the corrective phase, potentially forming the (II) wave within the blue box. The July chart shows that from that blue box low, XME has embarked on a powerful rally. The rally has unfolded with distinct sub-waves, particularly noticeable in the extension of wave (3), which then corrected in wave (4), and is currently extending higher in wave (5).
The 50% Rally and What’s Next
From the approximate low of the blue box around $48, XME has climbed to current levels near $72. This represents an impressive gain of approximately 50%. This strong rally confirms the validity of the Elliott Wave count. It anticipated a bounce from this key support area.
The current chart shows XME in what appears to be the final leg of an impulsive move. It is specifically targeting the completion of wave (5). The target of $76 is still ahead. This suggests further upside potential to complete this current impulse.
Conclusion
The Elliott Wave analysis successfully identified a high-probability reversal zone in XME back in April 2025. This led to a remarkable 50% rally. The price action since then has unfolded precisely as an impulsive five-wave structure. This reinforces the bullish outlook. With the $76 target still on the horizon, XME continues to demonstrate strong momentum. Traders will be watching for the completion of this current impulse before anticipating any significant corrective moves.
Source: https://elliottwave-forecast.com/stock-market/metals-mining-etf-xme-soars-blue-box-area-76-target/