
T-Mobile US Inc., TMUS, corrects against the long-term bullish sequence. Meanwhile, the pullback is evolving in a 7-swing structure and is close to the blue box. In this article, we will discuss the blue box where buyers will be waiting to buy the stock again.
T-Mobile US (NASDAQ: TMUS) is a leading U.S. wireless carrier, known for its aggressive pricing and nationwide 5G network. Headquartered in Bellevue, Washington, it is majority-owned by Deutsche Telekom. Since merging with Sprint in 2020, T-Mobile has become the third-largest U.S. telecom provider. It is listed on the NASDAQ-100 and S&P 500 indices.
TMUS Elliott Wave Analysis – Weekly Chart
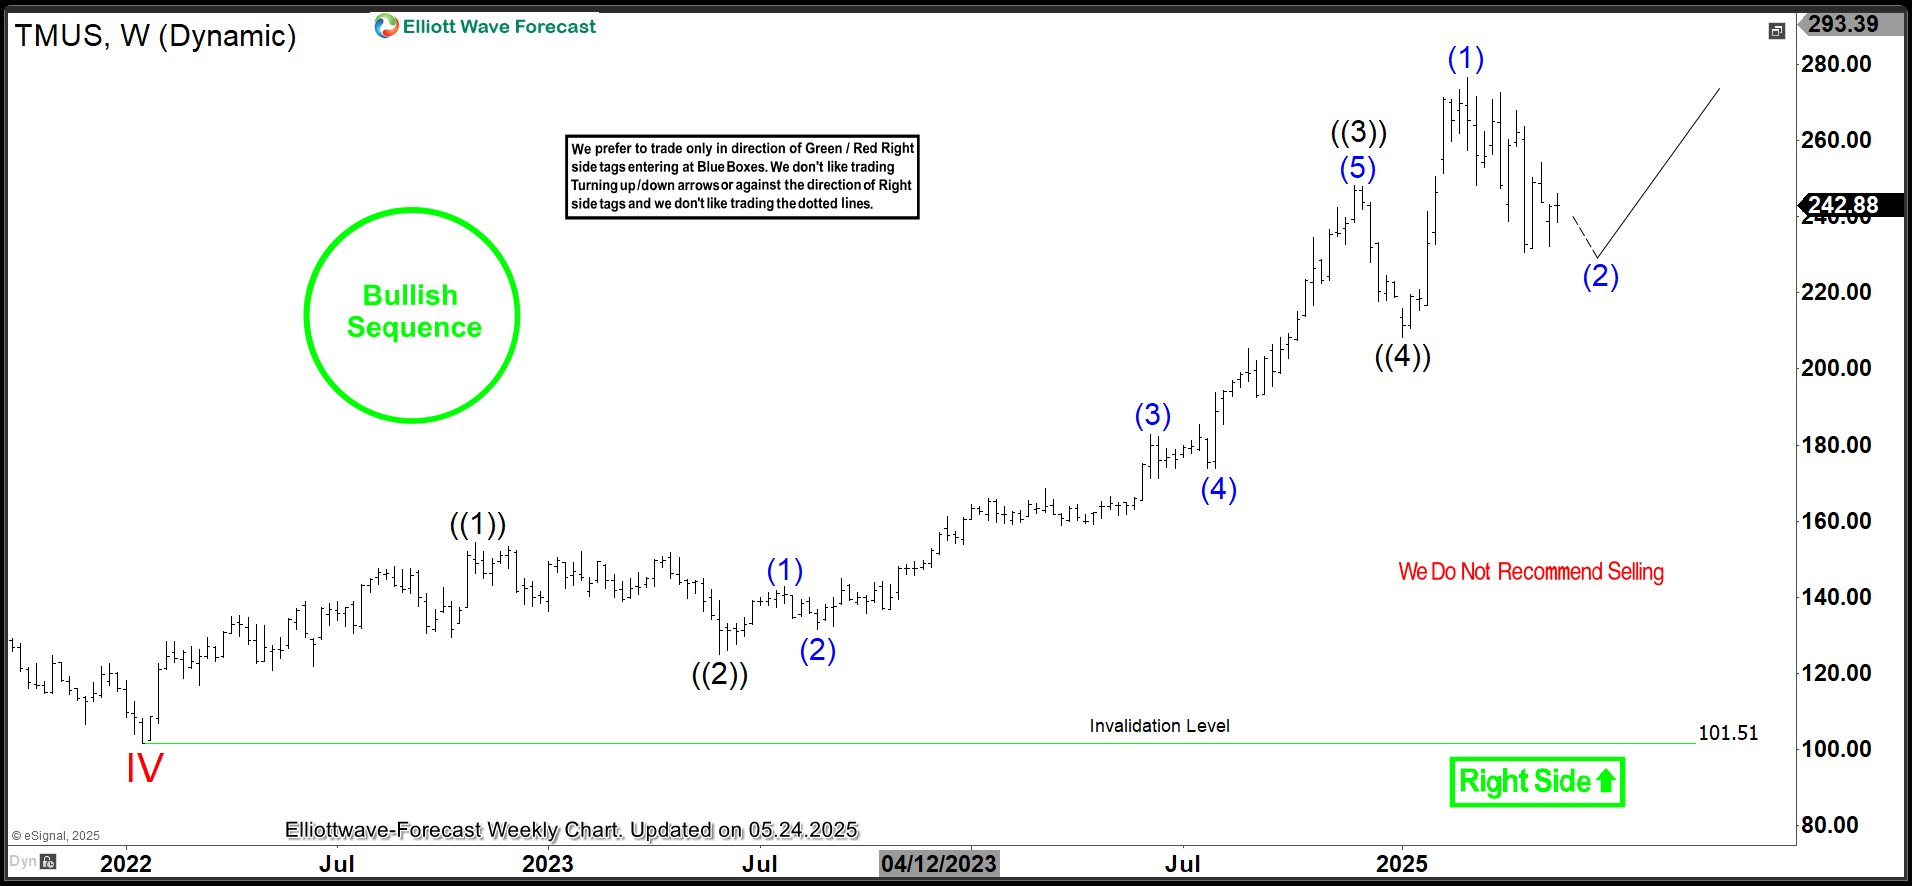
TMUS is in an all-time bullish sequence. Thus, it’s evolving into an impulse wave cycle from the all-time lows. The latest bullish cycle started in January 2022, where the cycle degree wave IV finished. From the January 2022 low, wave V emerged, and it’s currently in wave ((5)) of V. Wave ((1)) of V ended at the top of October 2022. Afterwards, the wave ((2)) dip followed and ended in May 2023. From the lows of May 2023, an impulse surge emerged that took the stock from barely trading at $125 to almost $250 in November 2024. A wave ((4)) dip followed to $208 in January 2025. Meanwhile, while the entire U.S. stock market fell in January/February 2025, this stock rose to a record high of $276.46.
However, this high could either be wave ((5)) of V, marking the completion of the cycle from January 2022, or it’s just wave (1) of ((5)). The former scenario requires a correction of the entire rally from January 2022. However, the latter still sees further rallies toward $300–400. What determined our preferred choice? First, the entire U.S. stock market is in a recovery state. Thus, one of its most bullish companies could be supported by the overall market. Second, the fall from the March high is corrective against the shorter cycle from January 2025, where wave ((4)) of V finished. Therefore, the pullback from March 2025 marks wave (2) of ((5)) of V.
TMUS Elliott Wave Analysis – Daily Chart
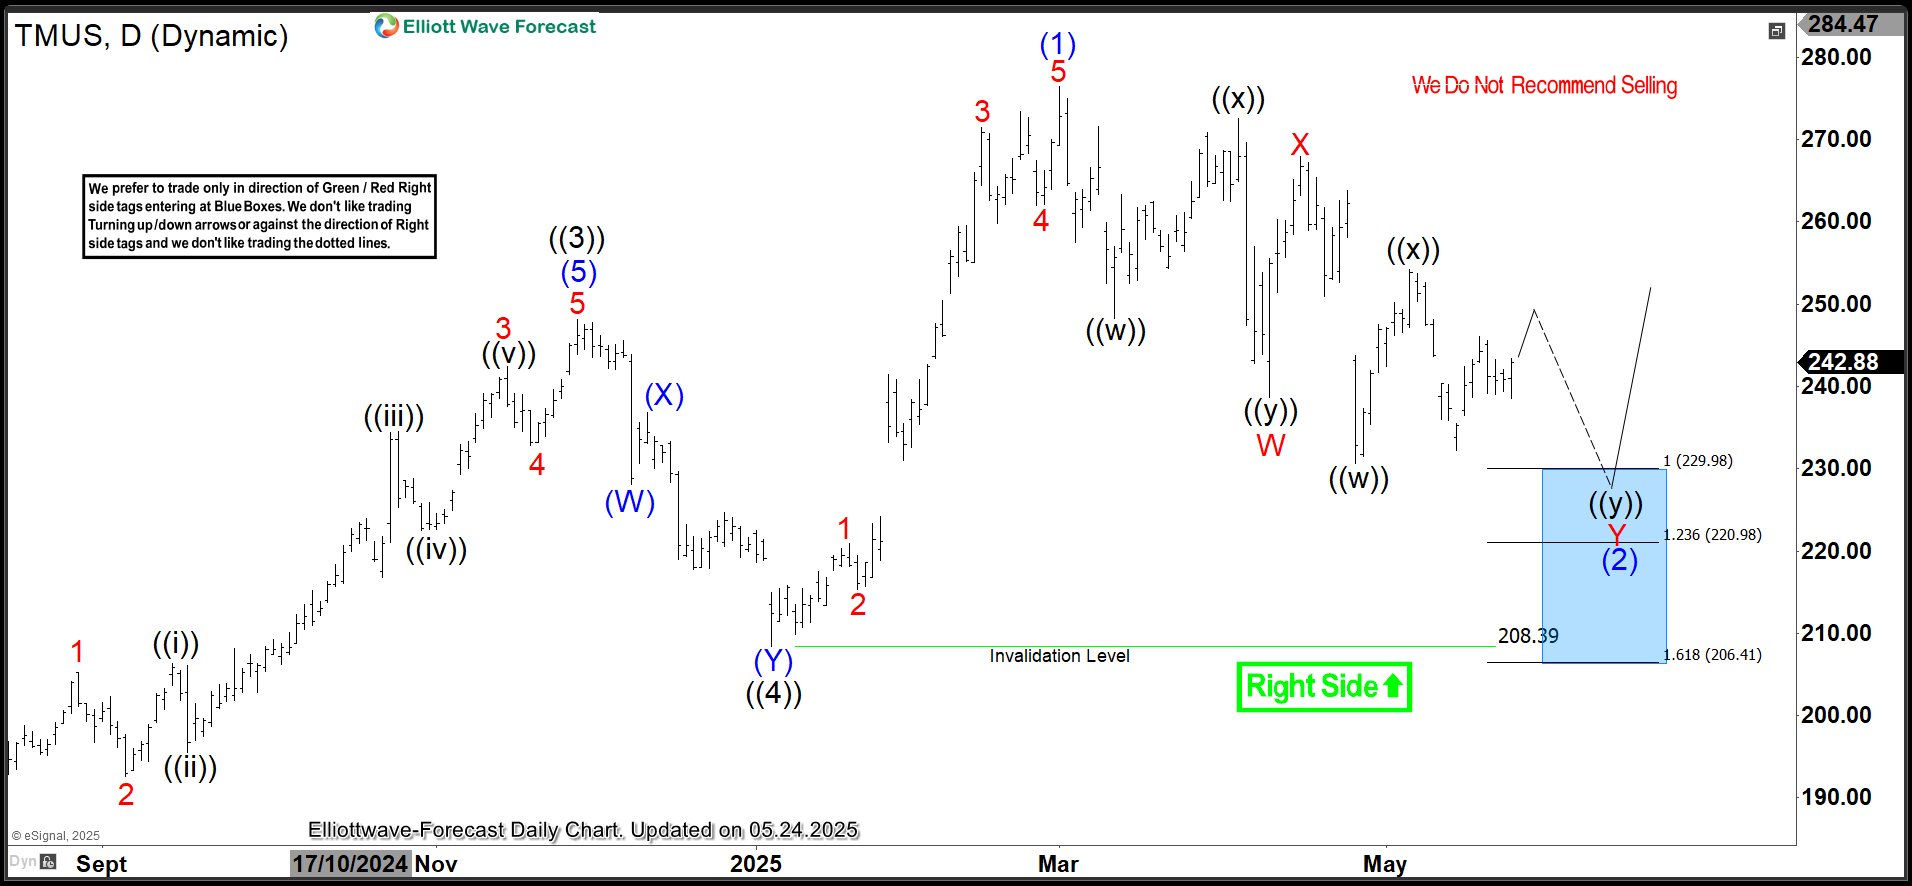
The daily chart above sheds some light on the wave (2) pullback from March 2025. The pullback is evolving into a double zigzag, 7-swing structure. In a strong bullish sequence like this, it’s best to buy from the extreme of a 3/7/11 swing pullback. The extreme of this 7-swing pullback is at 229.98–206.41. Thus, traders will eye this zone to buy into the next bullish phase. The next bullish phase could see the stock reach $300–400.
Source: https://elliottwave-forecast.com/stock-market/tmus-bullish-sequence-bluebox-support/