
Hello traders and welcome to a new blog post where we discuss trade ideas that Elliottwave-Forecast members took recently. Members recently went long on the EURNZD currency pair and are now close to the first target. The post will discuss how we came about the setup and how we intend managing the trade.
EURNZD has maintained a bullish corrective cycle since the lows of April 2015. The structure evolving is a double zigzag pattern for wave ((IV)) of the supercycle degree of the all-time bearish cycle. Meanwhile, it should be noted that this wave ((IV)) has not yet reached the target. Often times, corrective structures reach the extreme we expect unless price dictates otherwise. So far nothing of such information from the price. Thus, we continue to look forward to a higher prices until wave ((IV)) ends at the extreme area. Meanwhile, while it’s in progress, we explained to members why they should buy pullback in 3, 7 or 11 swing setup from the blue box. Thus, Group 2 members understand how to go about the trade. Good for us, a pullback emerged from the peak of April 2025. We were patient to see the pullback emerged into a clear 3-swing structure.
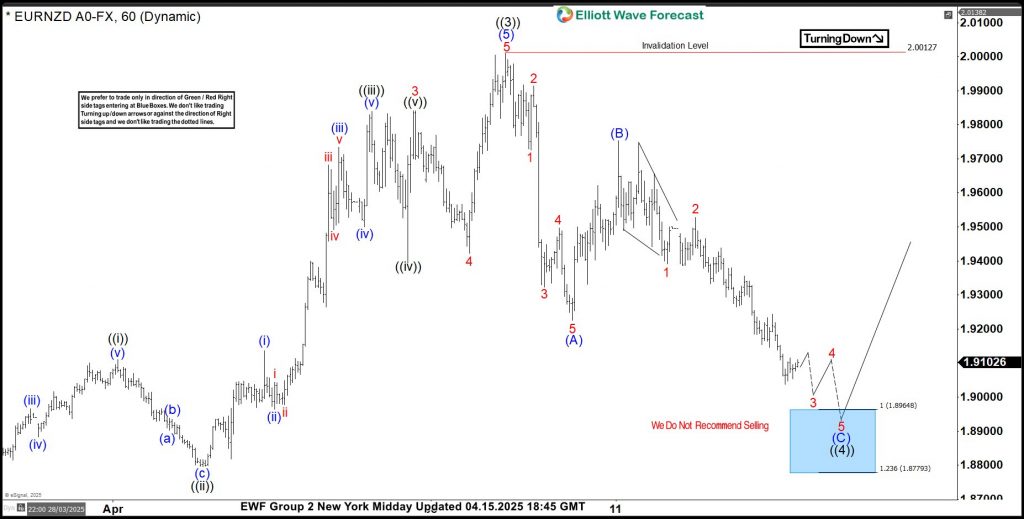
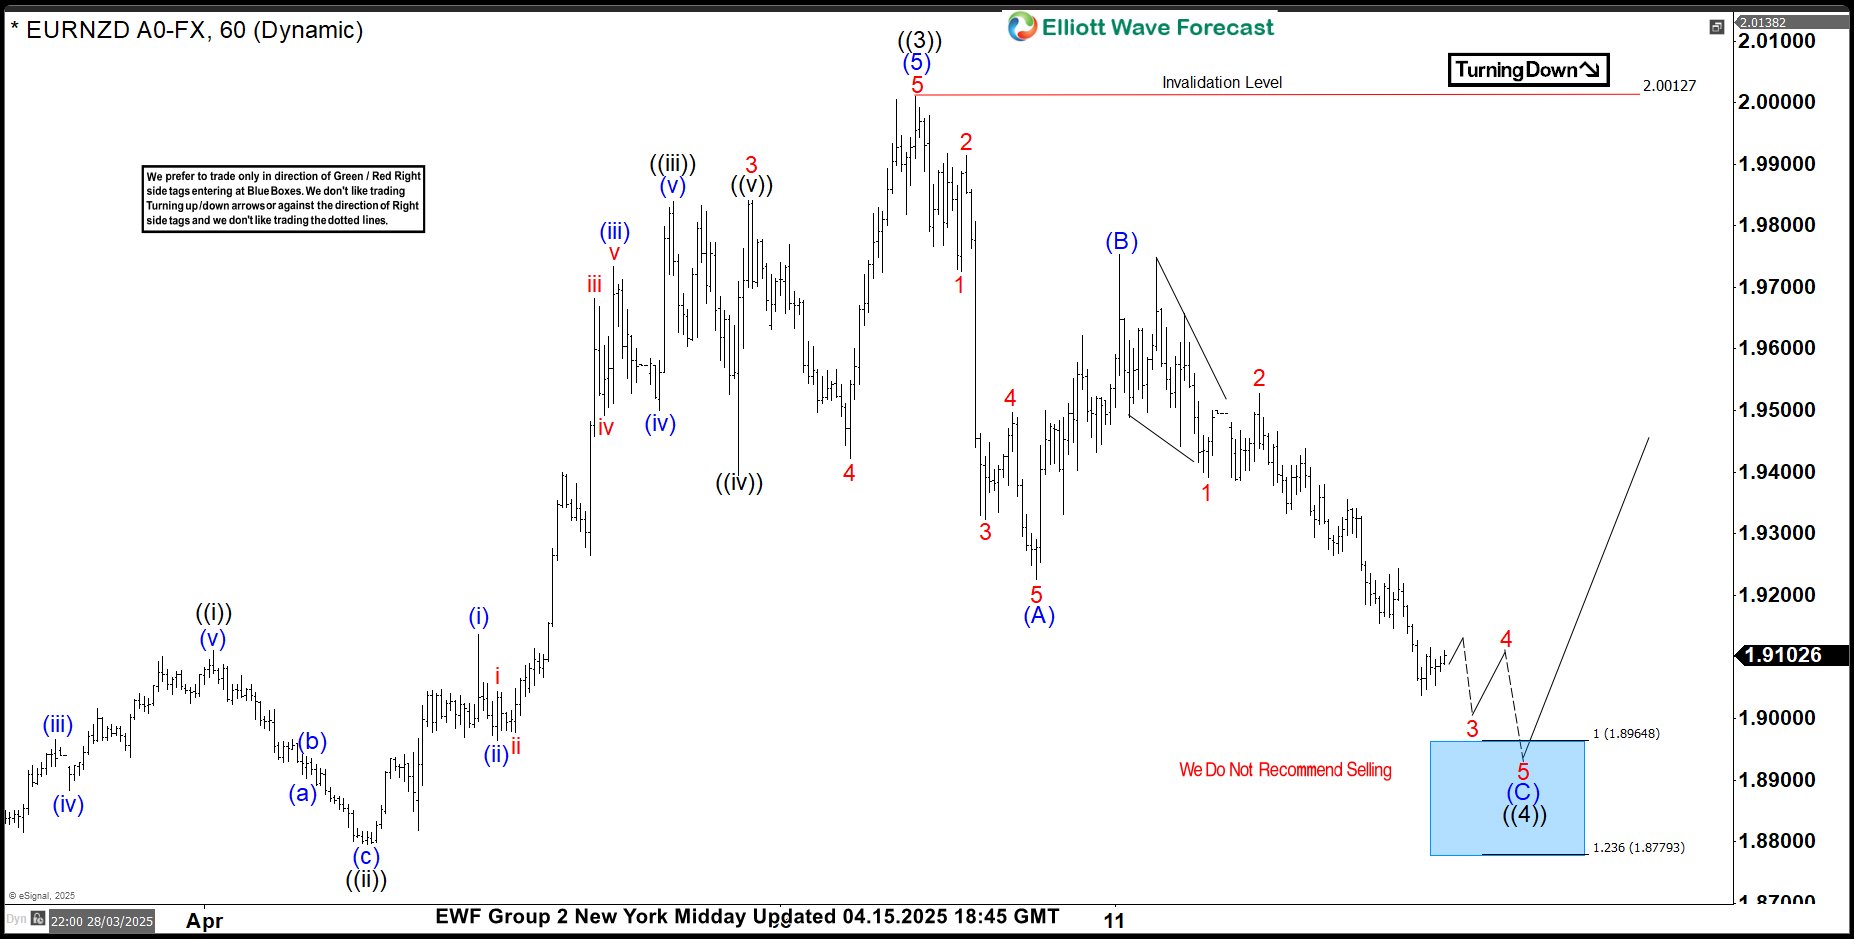
EURNZD Bullish Setup – 4.15.2025 Update
On 15th April 2024, we shared the chart above with members. The expected pullback was for wave ((4)) of the cycle degree wave c from September 2024. Wave ((4)) evolved lower with a 3-swing structure. Wave (A) of ((4)) finished with an impulse structure while wave (B) finished with a zigzag. As expected, wave (C) completed another impulse structure in the blue box. Thus, wave ((4)) was making a clear A-B-C corrective structure. We identified the blue box between 1.8964-1.8477 as the extreme area. Thus, we advised the group 2 members to buy at 1.8964 and set stop at 1.8477. What happened in the following few days?
EURNZD Bullish Setup – 4.15.2025 Update
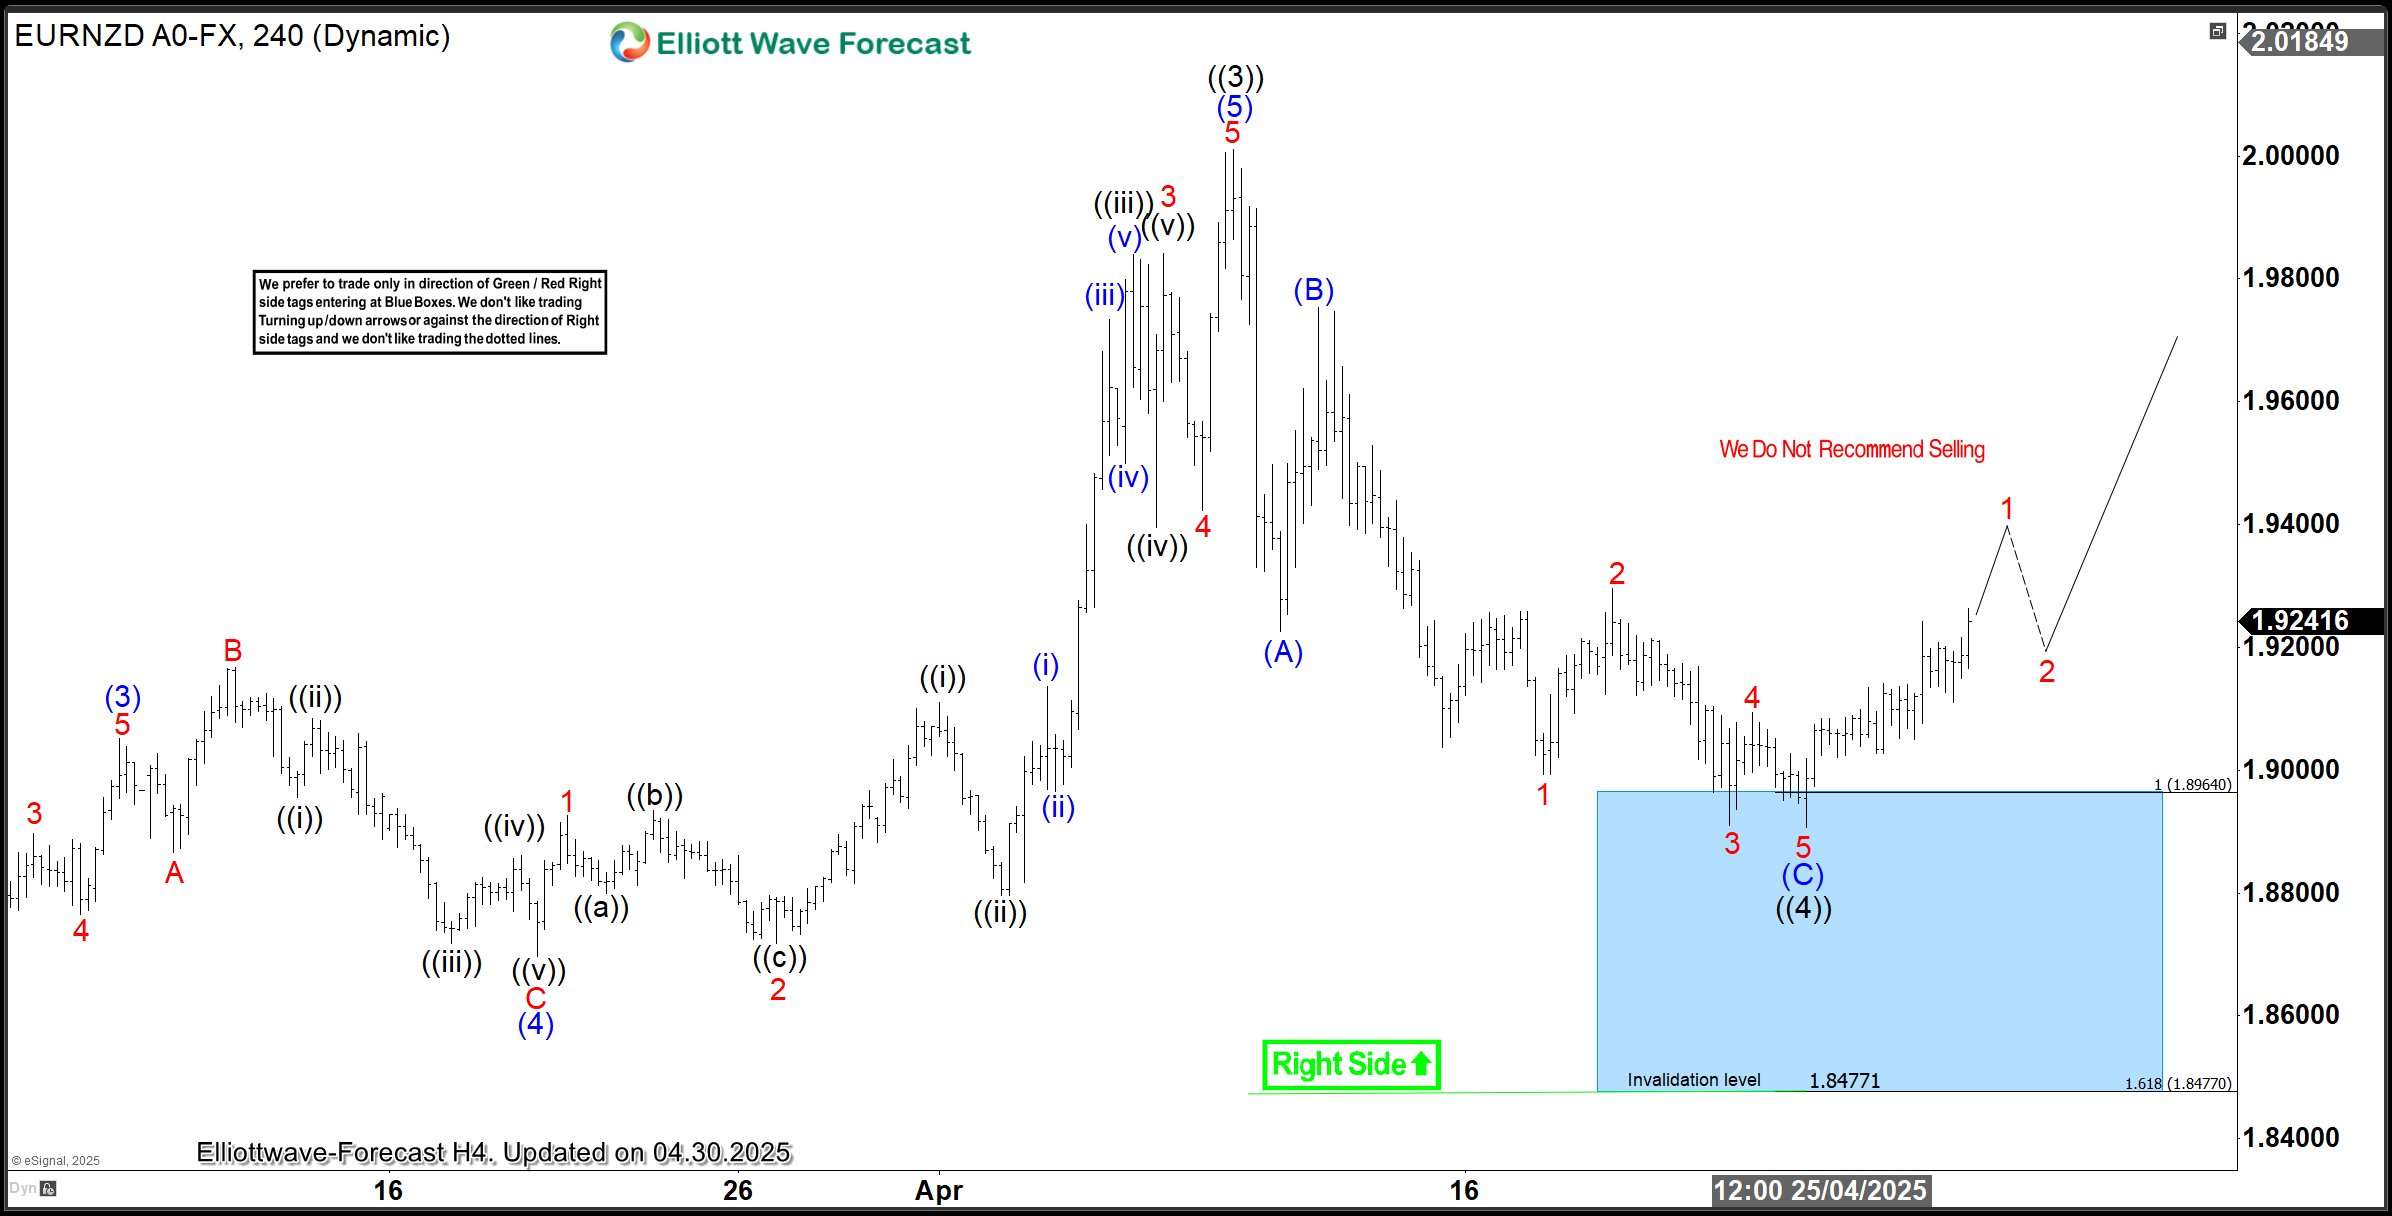
EURNZD found support in the blue box as expected. Price significantly touched the zone and triggered buyers into position. We shared the chart above with members on 25th April 2025. The chart shows price reacting higher from the blue box. The first target for this trade is at 1.933. At 1.933, members will close half of their positions in profit and adjust the rest to breakeven while expecting an impulse rally to evolve for wave ((5)). Meanwhile, the final target will be at 2.027 where traders can close the rest of their positions.
However, if the bullish response is not an impulse structure, it should be at least a 3-swing bounce before turning lower to attempt a double correction for wave ((4)) much lower. After a 3-swing bounce, price should at least hit the first target. Thus, this will allow members to hold some profit while closing down risk. If a 7-swing setup eventually happens lower for ((4)), we will like to buy again at the new extreme.
This is how we like managing this trade. We will expect an impulse rally and also prepare for a deeper ((4)). Until the wave ((IV)) cycle from April 2015 reaches the extreme, we will continue to go long from the blue box on both the H1 and H4 charts.
Source: https://elliottwave-forecast.com/forex/eurnzd-bullish-blue-box-setup/