L’Oréal S.A. is the world largest cosmetics and beauty company. Headquartered in Clichy, France, the field of activities concentrates on skin care, hair color, perfume, make-up, hair care, sun protection etc. L’Oréal is a part of Euro Stoxx 50 (SX5E) and CAC40 indices. Investors can trade it under the ticker $OR at Euronext Paris. As an interesting observation, during the COVID-19 lockdown in Europe from March to June 2020, the stock price has completely recovered from the February-March decline breaking to the new all-time highs.
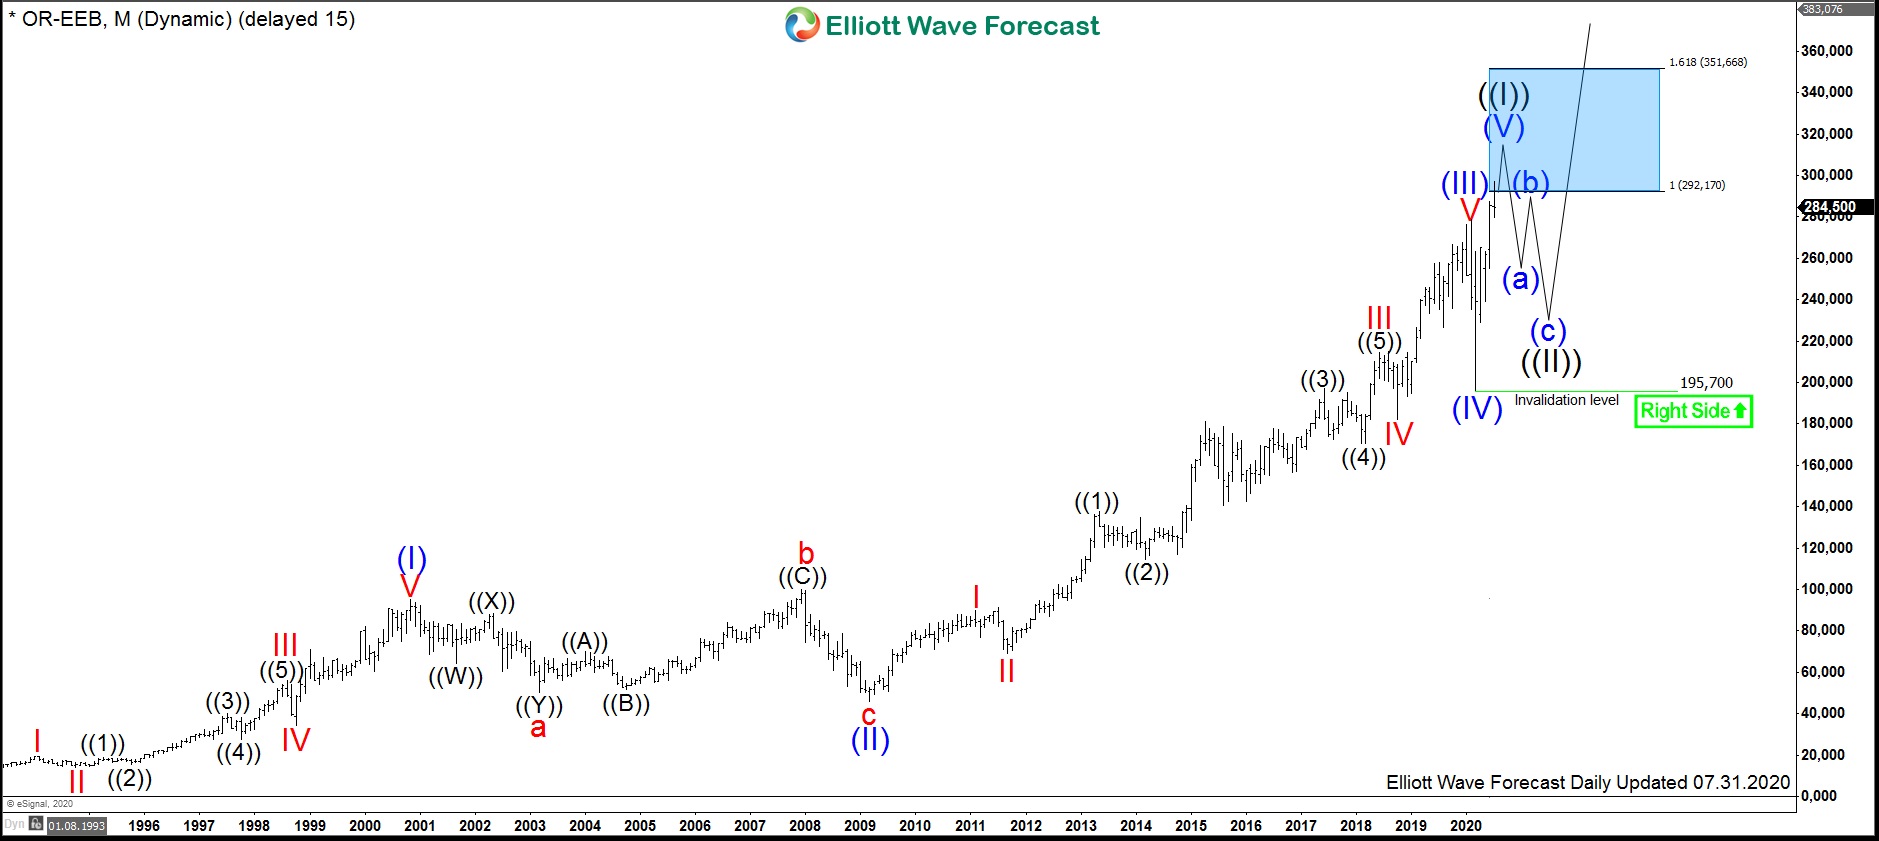
L’Oréal Monthly Elliott Wave Analysis 07.31.2020
The monthly chart below shows the L’Oréal stock $OR listed at Euronext. From the all-time lows, first, the stock price has developed a cycle higher in wave (I) of a super cycle degree. It is clearly an impulsive move consisting of 5 subwaves. Thereafter, a correction lower in wave (II) has unfolded as an Elliott Wave expanded flat pattern. It is a 3-3-5 pattern which has printed an important bottom on February 2009 at 46.5.
From the February 2009 lows, l’Oréal has accomplished an impressive rally in a cycle higher. This rise shows an extension of more than 2.0 multiples in relation to the length of the wave (I). Hence, it qualifies the cycle higher to become the wave (III). It has ended in February 2020 at 278.5.
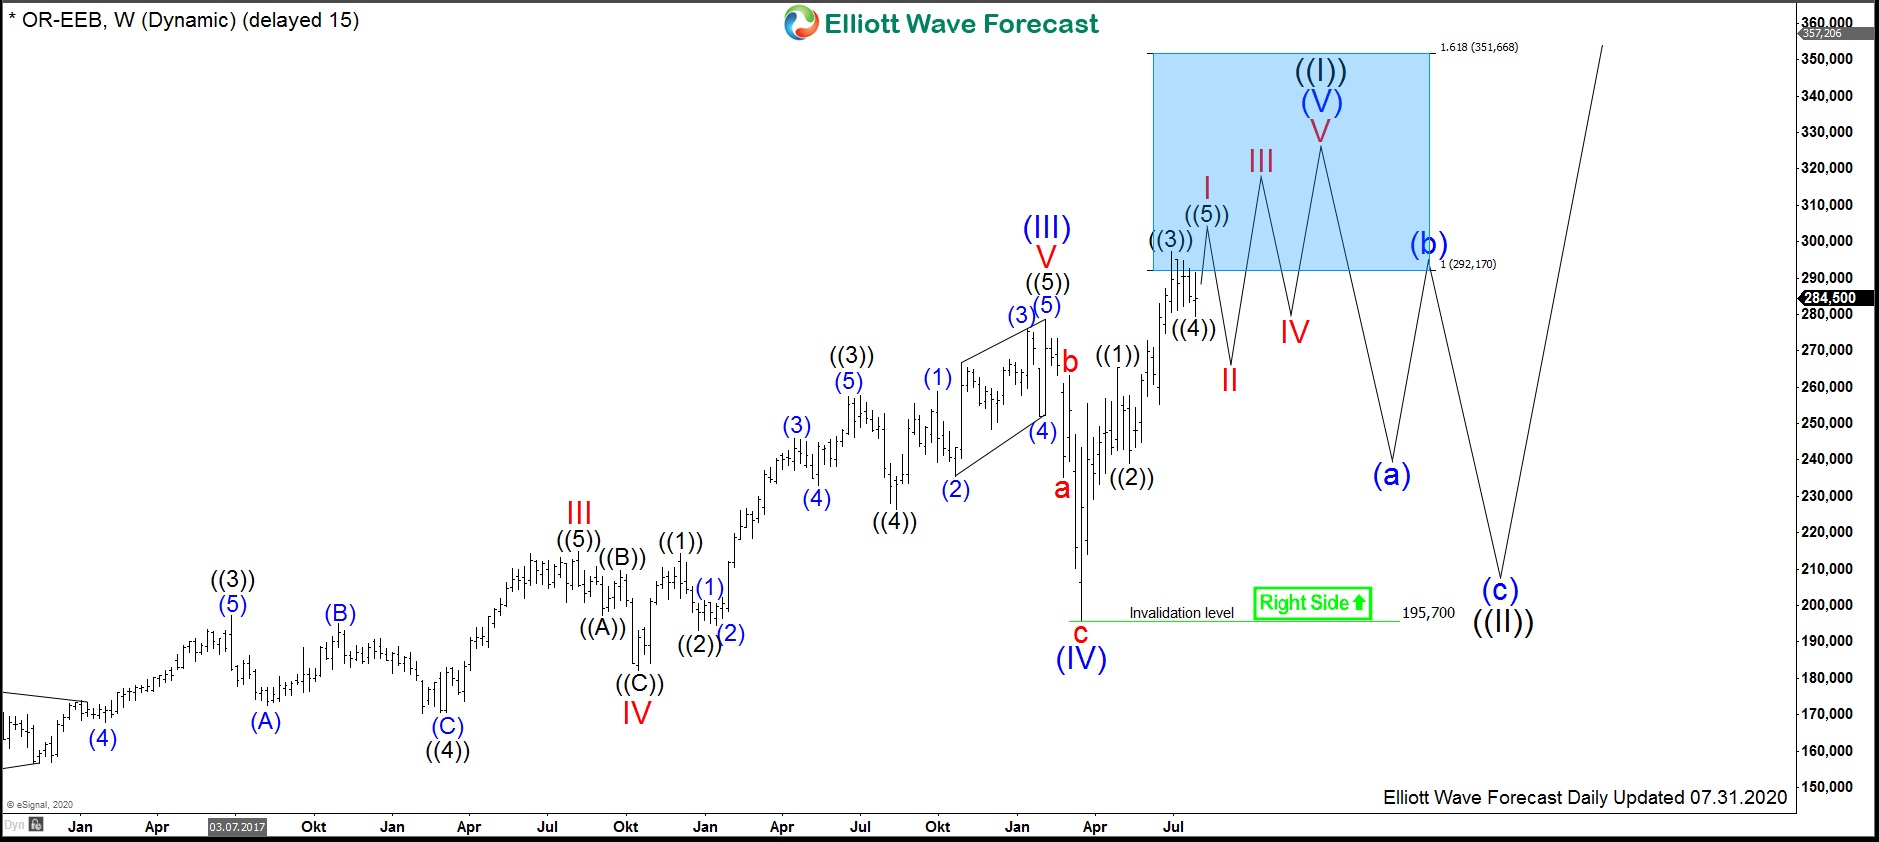
L’Oréal Weekly Elliott Wave Analysis 07.22.2020
The weekly chart below shows in more detail the topping action of the wave (III) and the further development of the $OR stock. From February 2020 highs at 278.5, a sharp corection lower in wave (IV) has retraced a respectable part of the motive cycle higher towards March lows at 195.70. Technically speaking, the decline can be seen as an Elliott Wave zigzag correction. From the March lows, the price has quickly recovered towards new all-time highs in wave (V) which might be still in progress.
Since the wave (III) has shown an extension, a usual target for the wave (V) to end would be 1.0-1.618 multiples of the wave (I). This target is shown as a blue box higher on both the monthly and weekly charts. The minimum target of 292.17 has been already reached. Even though it is time to become a bit cautious, nobody should even try fading an impulse by selling $OR. Still, more upside can be expected before wave (V) might end and a larger correction will take place.
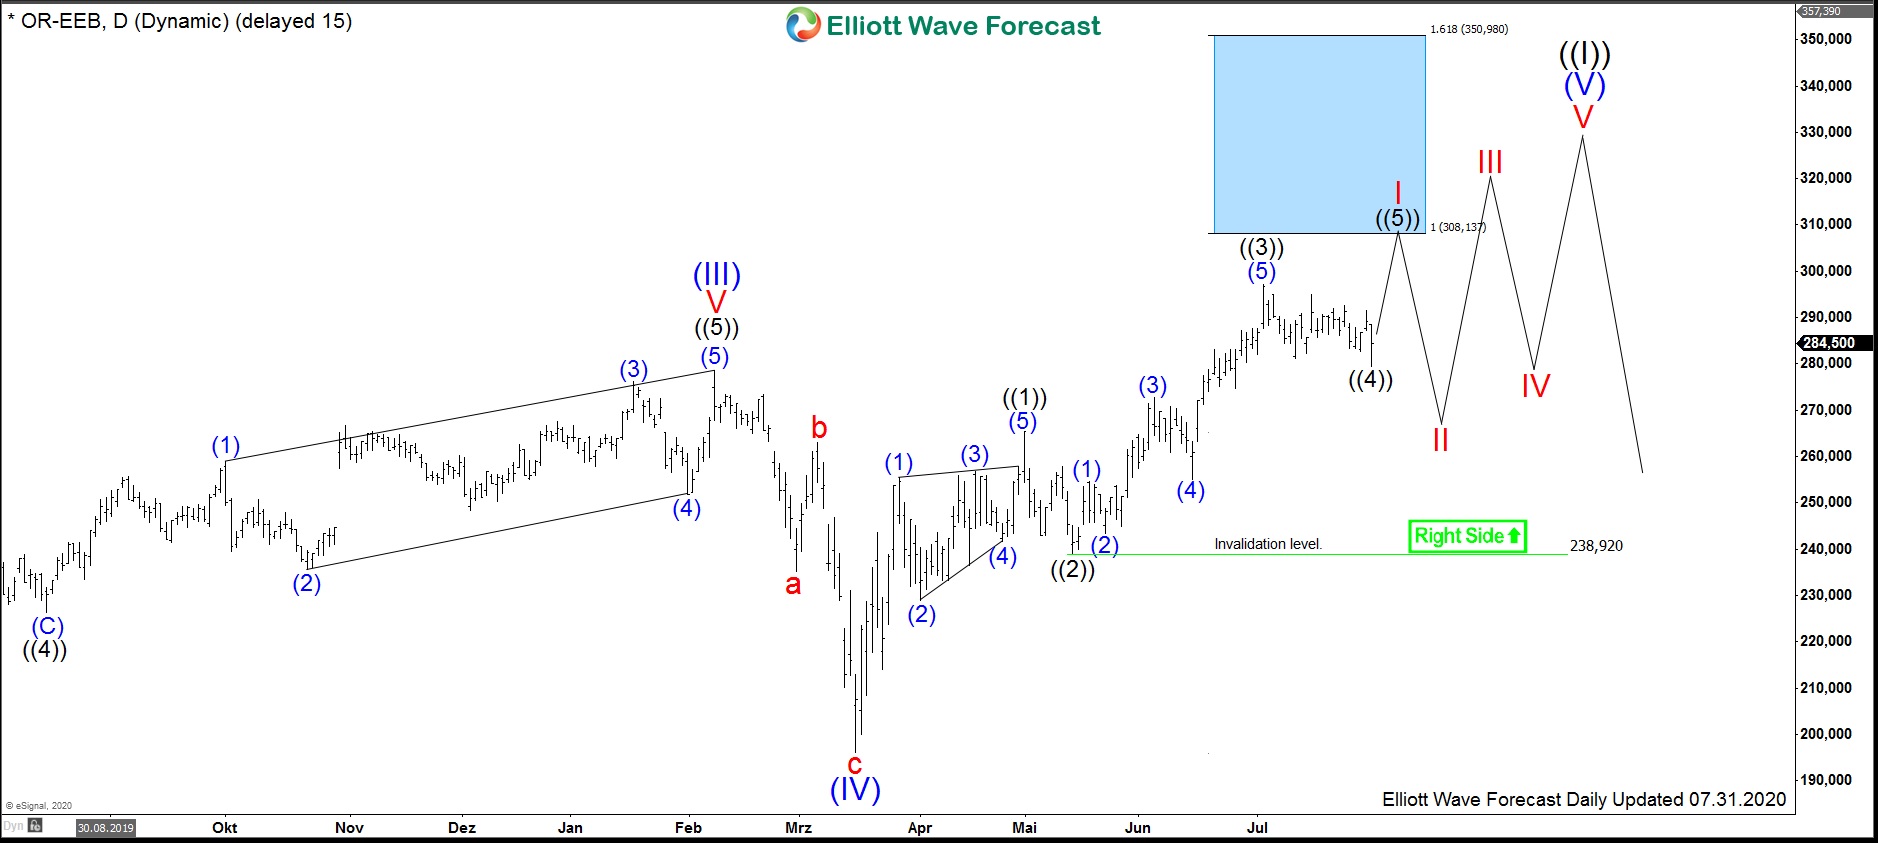
L’Oréal Daily Elliott Wave Analysis 07.31.2020
The daily chart below shows in more detail the internals of the wave (V). The advance higher is looking so far as 3 waves up. The wave ((3)) has not reached the equality with the first leg up in wave ((1)) at 308.13. Currently, wave ((4)) to correct the wave ((3)) is underway. Once bottommed, wave ((5)) should extend higher to end the march cycle in wave I. Based on the major world indices showing a topping behavior, the cycle higher from March lows may end soon. Thereafter, a pullback should take place. Depending on magnitude and RSI reading, this pullback can become wave II of (V) or the wave (II) lower.
As a general observation, L’Oréal is showing a clear motive cycle from the all-time lows, investors will do well when waiting for distinctive pullbacks and buying dips in 3, 7 or 11 swings.