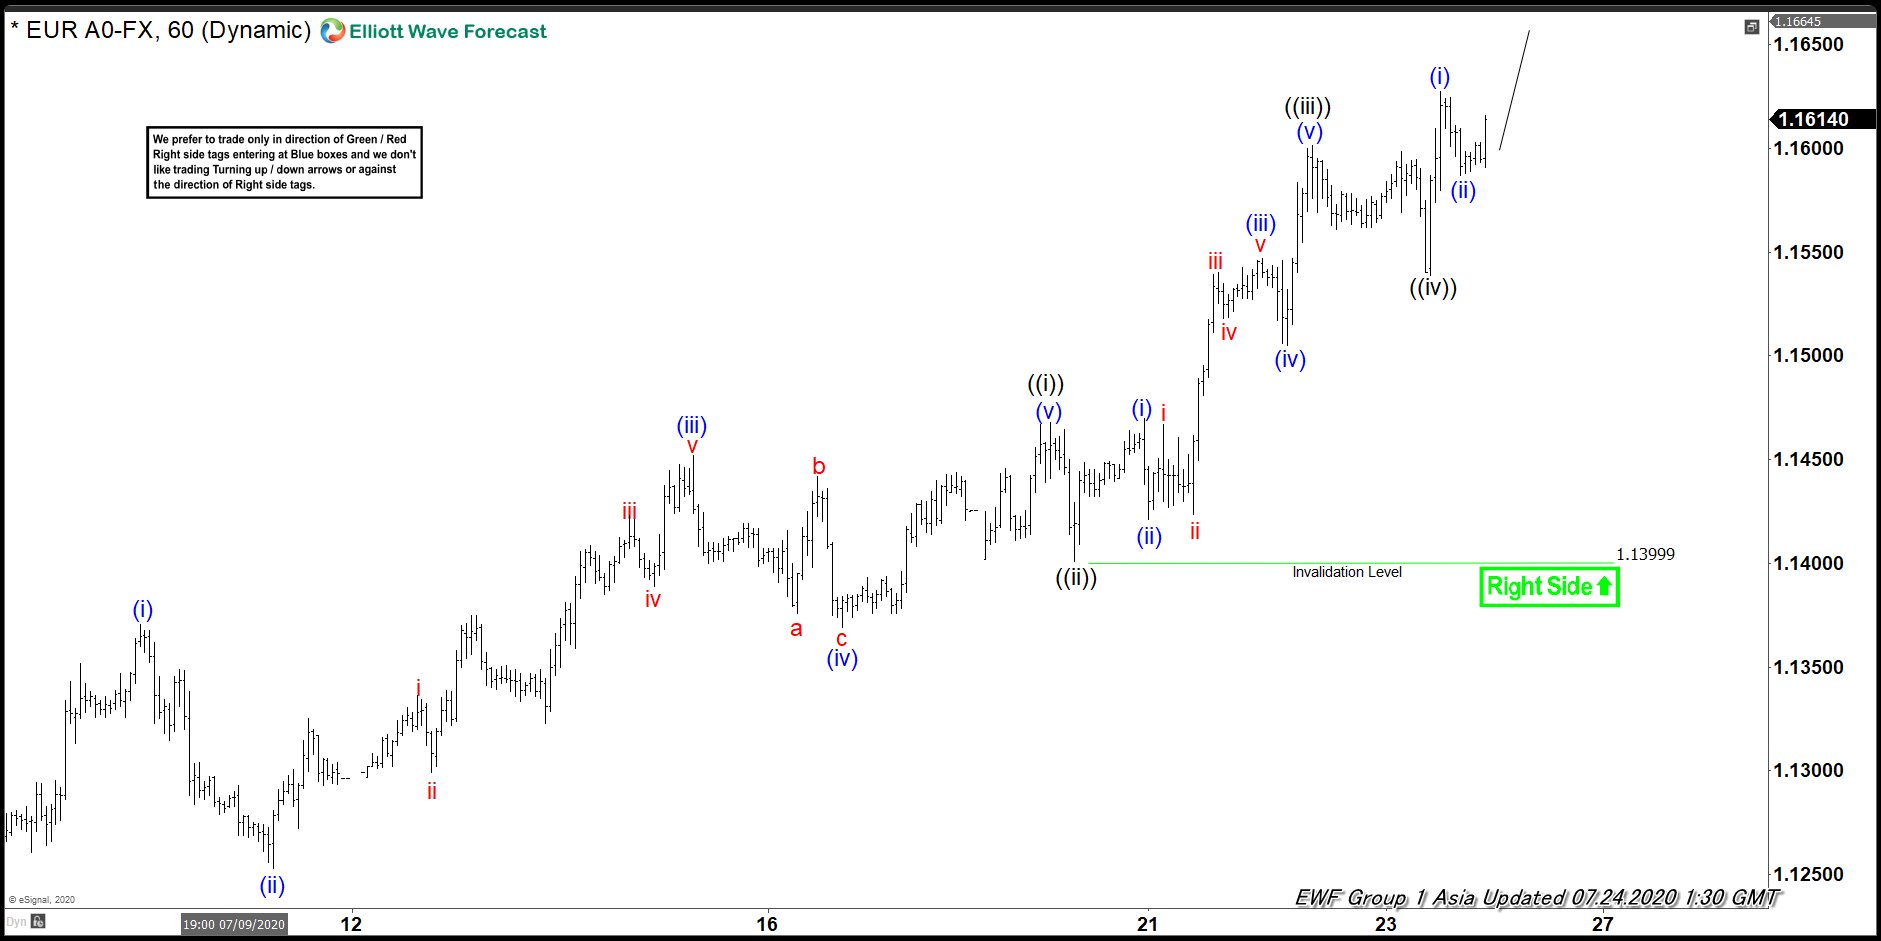
EURUSD 1 hour chart below shows that the pair has ended the cycle from July 1 low in wave ((i)) at 1.1467 high. The dip in wave ((ii)) then ended at 1.1399 low. From there, the pair has continued to extend higher. The rally broke above previous wave ((i)) high and ended wave ((iii)) at 1.1601 high. The internal subdivision of wave ((iii)) unfolded as a 5 waves impulsive Elliott Wave Structure. Up from wave ((ii)) low, pair ended wave (i) at 1.1469 high. The pullback in wave (ii) ended at 1.1438 low. The pair then extended higher in wave (iii), which ended at 1.1547 high. Wave (iv) dip ended at 1.1504 low. The last push higher in wave (v) ended at 1.1601 high. This ended wave ((iii)) in larger degree.
Afterwards, the pair did a pullback in wave ((iv)), which ended at 1.1538 low. Currently, wave ((v)) is in progress as the pair has resumed higher and broke above wave ((iii)) high. Wave (i) of ((v)) ended at 1.1627 high and wave (ii)) dip ended at 1.1587 low. While above 1.1399 low, expect dips in 3,7 or 11 swings to find support for more upside before pair ends 5 waves rally from July 1 low. The pair needs to break above wave (i) high to confirm that next leg higher has started. Otherwise, pair can still do a double correction in wave (ii) before turning higher again.
EURUSD 1 Hour Elliott Wave Chart