ForexCycle.com
  • Home
  • Forex Analysis
    • Long Term Forex Analysis
    • Short Term Forex Analysis
    • Special Focus
    • Daily Forex Reports
    • Forex Signals
  • Forex Articles
    • Market Cycle
    • Indicator
    • Elliott Wave
    • Fibonacci Sequence
    • Forex Market
    • Forex Trading
    • Technical Analysis
    • Chart Pattern
  • Trading Strategy
  • Forex Brokers
    • Avatrade
    • Broker News
    • Broker Review
  • Elliott Wave Courses
    • Markets Reverse
    • 5 Ways Using Trendlines
    • Overview of MACD
    • Relative Strength Index
    • Japanese Candlesticks
    • Moving Averages
    • Fibonacci Ratios
    • Two-Bar Pattern
    • Market Myths Exposed
  • Contact Us

EURUSD Daily Analysis – August 31, 2017

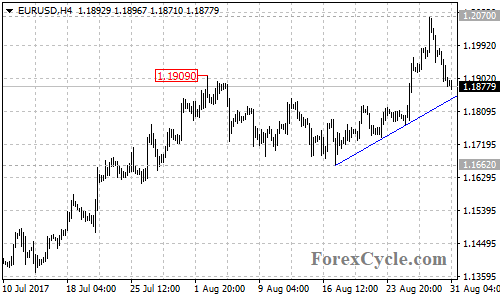
EURUSD stays above a bullish support trend line on its 4-hour chart and remains in the uptrend from 1.1662. As long as the trend line support holds, the uptrend could be expected to continue and next target would be at 1.2165 area. Only a clear break below the trend line support could bring price back to 1.1700 zone.

EURUSD 4-hour chart

Author ForexCycle.comPosted on August 31, 2017Categories Short Term Forex AnalysisTags EURUSD

Post navigation

Previous Previous post: CL_F Oil Elliott Wave View: Pullback in progress
Next Next post: GBPUSD Daily Analysis – August 31, 2017

Resources

  • Unlock Your Trading Potential with EA Builder
  • Elliott Wave Principle

Recent Posts

  • GBPUSD Calling the Rally After Elliott Wave Double Three Pattern
  • Elliott Wave Outlook: Microsoft (MSFT) Surges to Record High, Sustaining Bullish Momentum
  • Global Payments Inc. (GPN) Weekly Elliott Wave Analysis
  • TJX Companies (TJX): Is Bigger Rally Ahead After This Pullback?
  • Silver (XAGUSD) Rallies 29% Following April Blue Box Buy Zone
  • Alphabet Inc. $GOOGL Pullbacks Finding Buyers at Extreme Areas
  • DLF Ltd Elliott Wave Update: Stock Unfolding Its Final Impulsive Leg Toward New Highs
  • GBPUSD Elliott Wave: Forecasting the Rally from the Intraday Equal Legs
  • EURUSD Elliott Wave Outlook: Rally Unfolding from Equal Legs Support
  • Soybeans (ZS_F) Forecasting the Rally After Elliott Wave Zig Zag Pattern
  • Facebook
  • Instagram
  • Twitter
  • LinkedIn
  • Telegram
  • Home
  • Forex Analysis
  • Forex Articles
  • Contact Us
  • Forex Blog
  • Disclaimer
  • Forex Resources
  • Archives
  • RSS
Copyright © 2005 - 2025 ForexCycle.com. All rights reserved.