
Trend lines are a useful visual tool for Forex traders. They provide a pictorial representation of which direction a currency pair is moving in, so that a trader can determine whether it is a good time to buy or sell. It really is that simple.
If the lines on the graph are pointing upwards (towards higher figures), it is either a suitable time to invest in the currency pair or conditions are improving and it may become a good time for buying in the near future.
Conversely, if the trend lines are pointing down, the trader should attempt to make a sale or exchange before too much value (or any) is lost. For this reason, trend lines are very similar to price channels, with the difference being that there is only one guiding line.
Identifying Trend Types
The price channel is a kind of visual ‘container’ for the activities and fluctuations of the currency pair. Two lines are plotted according to the highest and lowest values. The top line signifies resistance (downward pressure). When the price approaches it, traders attempt to sell before the support line is hit and value drops.
The bottom line works in the opposite way. For successful Forex trading, you need to try and buy at the right time, before the resistance line is hit and the value stops rising. What a trend line does is visually connect the lowest and highest values. So, in a downward price channel, it would link the lowest low to the highest low on the graph.
Trend lines have the potential to alert a trader when a pullback (a move against current the direction) is due to end and fall back to the previous trend. Or, they can pinpoint when a trend is starting to reverse or speed up. There are five main types of trend:
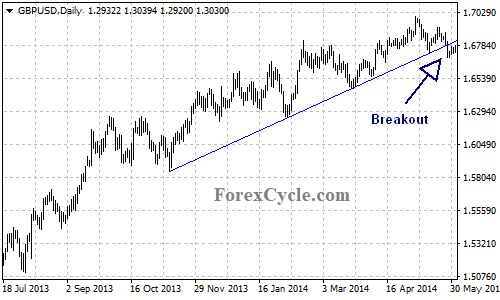
Bullish
Bullish trend lines extend upwards, from the left hand side of the graph towards the top right corner. They represent buy opportunities, because currency activities are moving closer to higher highs. When this happens, there is the potential for a currency pair to rise.
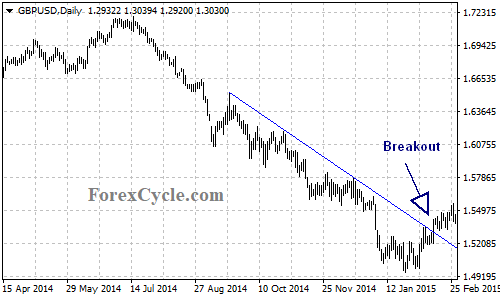
Bearish
Conversely, bearish trend lines indicate a pessimistic trading situation. There is more chance of lost value here, so it is a good opportunity to sell. Bearish trend lines extend upwards from the bottom right of the graph towards the top left corner.
Hawkish
Hawkish trend lines indicate a positive change to interest rates. This is when rates are increasing and it is a fertile time to make a purchase.
Dovish
Dovish trend lines, on the other hand, represent a positive drop in interest rates and a good opportunity to sell. The thing to remember about dovish and hawkish lines is that, in either case, traders have been waiting to capitalize on the change, which is why they are referred to as ‘favored’ fluctuations.
Flat/Ranging
When the trend line is completely flat and horizontal, there is no valuable activity within the price channel. The currency pair is neither climbing nor falling. Crucially, ranging lines normally precede a trend reversal. So, they suggest that the previous trend is about to be turned around.
Making Forex Trades with Trend Lines
As they can indicate the future direction of a price channel or currency pair, trend lines are a popular forex trading strategy. Like all strategies, their rate of success depends on a combination of skill and good luck. As explained, the lines are used to link up the lowest and highest values within a channel.
They may then be projected into future (predicted) channels as a way to make informed judgments about how the currency pair will change. By scrutinizing the prices and line extensions, forex traders can make tactical decisions regarding which currency pairs are the best for trading. The following are examples of how a trader might use trend lines:
Swing Highs and Swing Lows
This is when a trader is able to link up two low lying values (or high lying values) in an unbroken line (without price activity moving above or below). Once this happens, they can use the complete trend line to predict future price movements. If the currency approaches this level on another occasion, the trader may forecast a bounce by establishing entry orders and pinpointing the optimum time to jump into the trade.
The downside to this strategy is that, when lots of traders use it, orders may get stacked and the price doesn’t reach the trend line.
Forecasting the Future
As mentioned, trend lines are a great way to make logical predictions about future currency movements. In simple terms, when a trend line is approached with a bounce, the trader knows that it is likely to be valuable for the market. Nevertheless, all trends come to an end at some point, so traders have to be just as vigilant when it comes to predicting their reversal.
For a firm substantiation, you need to observe currency movements and take note if a price reacts from a trend line linking two points. If a third lowest low or highest low (or highest high and lowest high) is added, you can start to see a pattern emerging. In the future, there is a good chance that buying opportunities will develop whenever this trend is reached.
Purchasing and Offloading
Obviously, the perfect time to make a purchase is when a bullish trend line develops. Conversely, the optimal time to offload is when you can spot a bearish trend emerging. The thing to remember is that, if you can trade in conjunction with the movements and directions of established trend lines, you will benefit from a higher level of pips even if you don’t always make the winning trade.
Ultimately, the ideas behind the use of forex trend lines are pretty straightforward. If you can link up at least two highs or two lows, without a break (upwards or downwards) from currency activity from the channel, you have an opportunity to make some lucrative decisions. Don’t forget that the inclusion of a third bounce is what you need to fully validate a trend line.