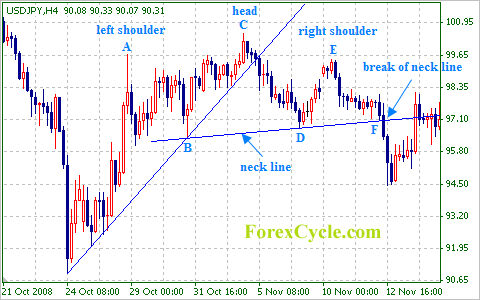
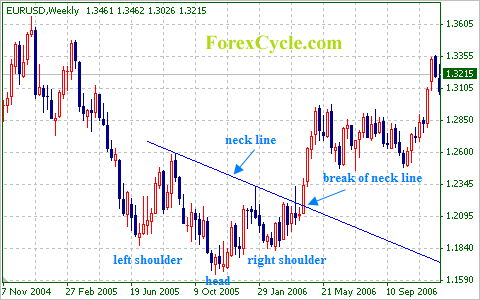
The head and shoulders pattern is a term used in technical analysis that refers to a pattern in which there is one high peak between two lower peaks, thus resembling a head and two shoulders. The lowest limit of both shoulders is called a neckline and it is used to find the crucial time in which buyers and sellers should exit or enter positions.
The head and shoulders pattern is one of the most well known patterns appearing in charts. However, it is not dependable at all times. The pattern is useful when it is considered to be a reversal pattern and it takes place in four stages.

During the first stage, a small peak appears. It is here identified as point A and represents the left hand shoulder. This is followed by a reverse movement. Subsequently, more active buying takes place, giving shape to the head (point C). Another reverse movement takes place after the head, probing the neckline, or support. Then a recovery is attempted, thus creating another peak (point E), which will be lower than the head. Yet another reverse movement occurs subsequently and probes the support.
B and D on the chart represent local minima points.
Head and shoulders is considered to be a reversal pattern where a break in the support is anticipated, which is supposed to be approximately the same as the movement from the head to the support.
The movement is not dependable because the ultimate probe of the support does not as a rule have the outcome of a break and the movement goes on as earlier. Hence, you should always wait for an explicit break of the support, which should about around 15 to 25 pips, prior to taking any steps. The impetus of the movement should be taken into account, i.e. it is supposed to be higher at the time of the creation of the shoulder on the left hand side than the shoulder on the right hand side. This is how we can verify whether the pattern is occurring and whether buying pressure is dropping.
The reverse head and shoulders pattern needs no explanation since it is formed in a similar way. The only difference is that it is flipped upside down.


