
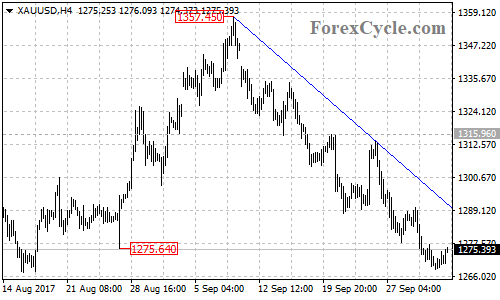
XAUUSD stays below a bearish trend line now at around 1291.35 on its 4-hour chart and remains in the downtrend from 1357.45. As long as the price is below the trend line, the downtrend could be expected to continue.
On the downside
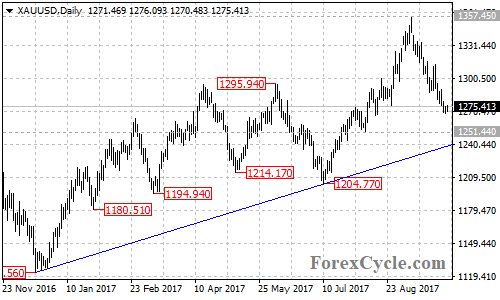
The gold price could be expected to test near term support level at 1251.44. Below this level could take price to the bullish trend line from 1122.56 to 1204.77 on the daily chart now at around 1239.50. A clear break below the trend line support could confirm that the uptrend from 1122.56 had completed at 1357.45 already, then next target would be at 1204.77, followed by 1180.
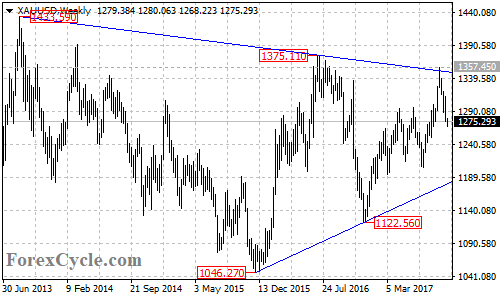
There is an important bullish trend line from 1046.27 to 1122.56 with support at around 1180 on the weekly chart. Rebound could be expected after the touch this trend line.
On the upside
A clear break above the trend line on the 4-hour chart could indicate that the downside movement from 1357.45 is complete, then the following correction rebound could bring price back to test next resistance level at 1315.96.
For long term analysis
The gold price is forming a triangle pattern on its weekly chart. The price failed in its attempt to breakout of the resistance trend line from 1433.59 to 1375.11 and pulled back from 1357.45. So another fall towards the support trend line would likely be seen over the next several weeks.
Technical levels
Support levels: 1251.44 (the August 8 low), 1239.50 (the bullish trend line on the daily chart), 1204.77 (the July 10 low), 1180 (the support trend line on the weekly chart).
Resistance levels: 1291.35 (the bearish trend line on the 4-hour chart), 1315.96 (the September 20 high), 1357.45 (the September 8 high), 1375.11 (the July 2016 high), 1400 (the important psychological level).