
AUDUSD rebounded strongly to 0.7960 area after approaching the bullish trend line on its daily chart, suggesting that the pair remains in the uptrend from 0.7328 and the pullback from 0.8065 could be treated as consolidation of the uptrend.
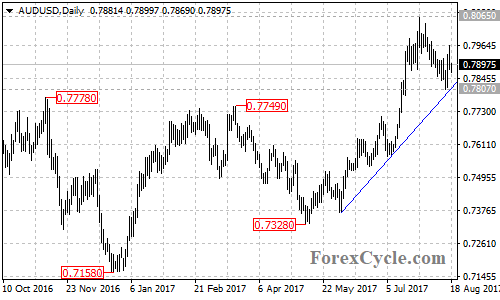
As long as the price is above the bullish trend line, the uptrend from 0.7328 could be expected to resume and another rise towards the May 2015 high of 0.8162 is possible after the consolidation.
On the 4-hour chart, the AUDUSD pair recently broke above a bearish price channel at 0.7890, indicating that the downside movement from 0.8065 had completed at 0.7807 already. The pair is now in short term uptrend from 0.7807, the fall from 0.7962 could be treated as correction of the uptrend. A break above 0.7962 resistance could take price to the next resistance level at 0.8065, above this level will signal resumption of the uptrend from 0.7328.
The key support is located at 0.7807, only a breakdown below this level will confirm that the bullish move from 0.7328 had completed at 0.8065 already, then the following downside move could bring price to test the next support level at 0.7700.
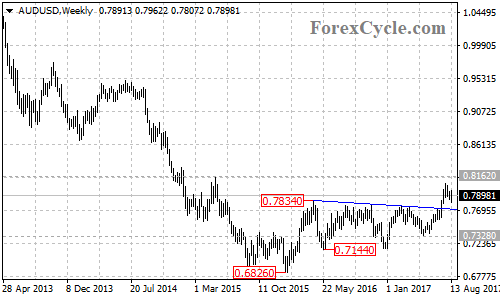
There is a resistance-turned-support trend line with support at around 0.7700 on the weekly chart. If the trend line support gives way, the fall would extend towards 0.7328.
Technical levels
Support levels: 0.7807 (the August 15 low), 0.7700 (the resistance-turned-support trend line), 0.7328 (the May 9 low), 0.7144 (the May 2016 low), 0.6826 (the January 2016 low).
Resistance levels: 0.7962 (the August 17 high), 0.8065 (the July 27 high), 0.8162 (the May 2015 high), 0.8450 (the 38.2% Fibonacci retracement taken from the July 2011 high of 1.1080 to the January 2016 low of 0.6826).