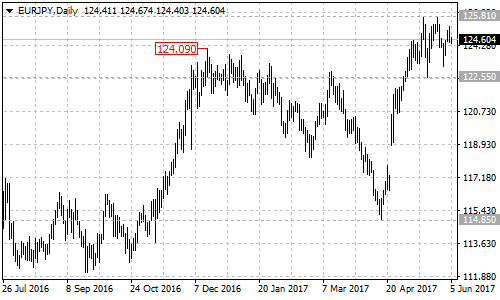
After breaking above the major resistance of the December 2016 high of 124.09, EURJPY formed as sideways movement in a trading range between 122.55 and 125.81. All we can do now is to wait for the breakout to occur.

On the upside
Near term support is at bottom of the trading range of 122.55, a breakdown below this level could take price to the next support level of the 38.2% Fibonacci retracement taken from the April 17 low of 114.85 to May 16 high of 125.81 at 121.60. As long as this support level holds, the price action of the sideways movement could be treated as consolidation of the bullish move from 114.85, and further rise towards 135.00 is still possible after the consolidation. Near term resistance is at the top of the trading range of 125.81. A break out of this level could signal resumption of the uptrend.
On the downside
A breakdown below 121.60 Fibonacci support will indicate that lengthier consolidation for the long term uptrend from the June 2016 low of 109.04 is underway, then the following correction pullback could take price back into 116.60 zone.
Technical levels
Support levels: 122.55 (near term support), 121.60 (38.2% Fibonacci retracement), 116.60.
Resistance levels: 125.81 (near term resistance), 130.00, 135.00.

