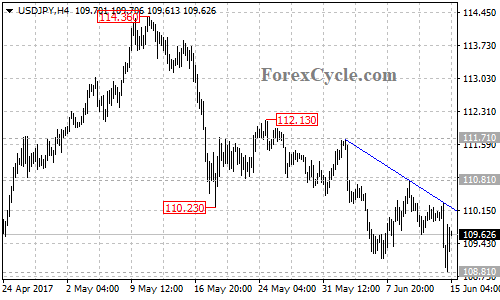
USDJPY’s bearish movement from 114.36 extended to as low as 108.81. Near term resistance is at the descending trend line on the 4-hour chart. As long as the pair is below the trend line, the bearish movement could be expected to continue and further decline to test 108.13 (Apr 17 low) support is still possible. Key resistance is at 110.81, only break above this level will indicate that the bearish movement had completed at 108.81 already, then the following upside movement could bring price back into 113.00 zone.