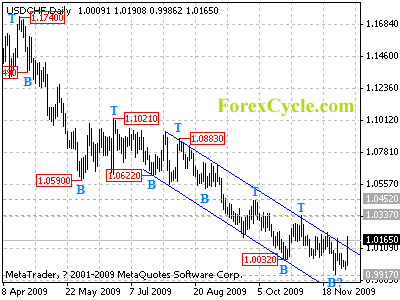
USDCHF broke above the resistance of the upper border of the falling price channel on daily chart. Sideways movement in a range between 0.9917 and 1.0337 is expected in a couple of week. As long as 1.0337 key resistance holds, the price action in the trading range is treated as consolidation of downtrend from 1.1021, and another fall towards 0.9800 is still possible. However, a break above 1.0337 will indicate that the fall from 1.1021 has completed, then further rally could be seen to 1.0800 zone.
For long term analysis, USDCHF is in long term bearish movement from 1.1963, further fall is still possible to 0.9800 level.


