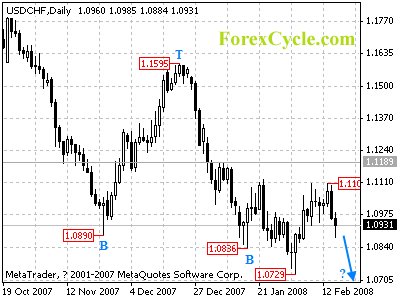
USDCHF is forming a cycle top at 1.1105 level on daily chart, key support is at 1.0860 level, a break of this level will confirm the cycle top, and further fall to test the previous low support at 1.0729 is expected to follow. Near term resistance is at 1.1105, only break of this level will indicate lengthier correction to the long term down trend.
For long term analysis, USDCHF is in long term down trend, further fall towards 0.9000 to reach the next cycle bottom on weekly chart is expected.


