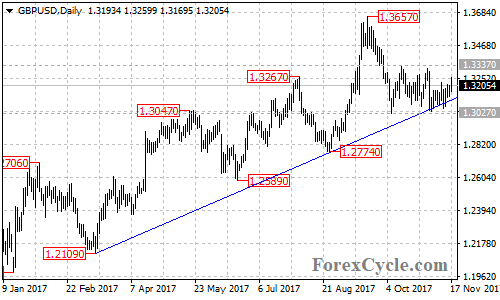
GBPUSD stays above a bullish trend line on the daily chart and remains in the uptrend from 1.1946 (Oct 2016 low). As long as the price is above the trend line, the fall from 1.3657 could be treated as consolidation of the uptrend and another rise to the falling trend line on the weekly chart is still possible. Key support is at 1.3027, only a breakdown below this level will confirm that the uptrend had completed at 1.3657 already, then the pair would find next support level at 1.2774. Below here would aim 1.1946 previous low.